
DRAG
Techcadd

Data Analyst Certification Course in Mohali — 2026–27 Batch

Future Scope of Data Analytics and Career Opportunities The future scope of data analytics is growing rapidly as organizations across the world increasingly depend on data to make better business decisions. Every day, b…

Industry-Ready Curriculum
Expert Mentors
100% Placement Support
  • Home
  • Courses
  • Data Analyst Certification Course in Mohali — 2026–27 Batch
13+
Years of Experience
10K+
Students Trained
4.8
14 Student Reviews
95%
Placement Rate
Data Analyst Certification Course in Mohali — 2026–27 Batch

Future Scope of Data Analytics and Career Opportunities

The future scope of data analytics is growing rapidly as organizations across the world increasingly depend on data to make better business decisions. Every day, businesses generate enormous amounts of information through customer interactions, websites, mobile applications, online transactions, social media, marketing campaigns, financial systems, and operational processes. However, collecting large amounts of information is not enough. Organizations need skilled professionals who can organize, clean, analyze, interpret, and present data in a meaningful way. This increasing dependence on data has created strong opportunities for professionals with practical data analytics skills.

The Data Analyst Certification Course in Mohali — 2026–27 Batch is designed to help learners build a strong foundation in important analytics tools and concepts. By learning technologies such as Excel, SQL, Python, Power BI, Tableau, statistics, and data visualization, students can prepare themselves for a wide range of analytical roles and future career paths.

Data analytics is not limited to a single industry. Almost every modern organization uses data to understand its customers, measure performance, improve operations, and identify opportunities. This means that professionals with strong analytical skills can explore opportunities across different sectors and continue developing their careers as technology evolves.

Growing Importance of Data in Business

Businesses today make many important decisions based on data. Companies analyze sales performance to understand which products are performing well. Marketing teams study campaign results to identify which strategies generate better engagement. Financial organizations use data to monitor transactions and identify patterns. Healthcare organizations analyze information to improve services and operations.

Because of this growing use of information, the role of a Data Analyst has become increasingly important. A Data Analyst helps transform raw information into useful insights that can support decision-making.

For example, a business may have thousands of customer transactions stored in a database. Without analysis, it may be difficult to understand which products are popular, which locations perform well, or which customers contribute the most revenue.

A Data Analyst can use SQL, Excel, Python, Power BI, or Tableau to organize this information and answer important questions.

As more organizations adopt digital systems, the volume of available data is likely to continue increasing. This creates a long-term need for professionals who understand how to work with information effectively.

Career Opportunities After Learning Data Analytics

After developing strong practical skills, learners can explore different career paths related to data, reporting, and business intelligence.

One of the most common roles is Data Analyst. Data Analysts collect, clean, analyze, and interpret information. They create reports and dashboards that help organizations understand performance and identify important trends.

Another possible role is Business Intelligence Analyst. Professionals in this area focus on business reporting and dashboard development. They may work with Business Intelligence tools to create interactive reports for managers and decision-makers.

Learners can also explore Reporting Analyst positions. Reporting Analysts prepare regular reports that help organizations monitor important metrics such as sales, revenue, customer activity, employee performance, and operational results.

An MIS Analyst is another possible career path. MIS professionals often manage reports and information systems used by organizations for internal decision-making.

With additional business and communication skills, learners may also explore the role of Business Analyst. Business Analysts focus on understanding business problems, gathering requirements, analyzing processes, and supporting improvements.

Other opportunities may include junior analytics roles, data operations positions, dashboard development roles, and analytics consulting positions.

The exact responsibilities of these roles may differ from one organization to another, but strong skills in data analysis, reporting, visualization, and problem-solving can provide a valuable foundation.

Opportunities Across Multiple Industries

One of the biggest advantages of learning data analytics is that the skills can be applied across different industries.

The IT industry uses data analytics for software performance, customer insights, product analysis, and business reporting.

The banking and financial sector uses data to monitor transactions, understand customer behavior, analyze financial performance, and identify unusual patterns.

The healthcare industry uses information to study operational performance, patient services, resource utilization, and other important areas.

E-commerce companies analyze customer purchases, product performance, website activity, and marketing results.

The retail industry uses analytics to understand customer preferences, manage inventory, and analyze sales trends.

Manufacturing organizations analyze operational information to improve efficiency and monitor production processes.

The education sector can use analytics to understand student performance, course engagement, and institutional operations.

Marketing and advertising organizations also rely heavily on data to understand campaign performance and customer engagement.

Because analytical skills are useful in so many industries, Data Analysts are not restricted to one particular domain. Professionals can develop industry-specific knowledge over time and specialize in areas that interest them.

The Importance of Excel, SQL, and Python

The future of a Data Analyst depends on building a combination of practical skills rather than relying on only one tool.

Excel continues to be useful for business reporting, calculations, quick analysis, and data organization. Many companies continue to use spreadsheets as part of their daily workflow.

SQL is highly valuable because databases are used by organizations to store structured information. Analysts who understand SQL can retrieve and analyze information directly from databases.

Python provides additional capabilities for data cleaning, automation, analysis, and visualization. Libraries such as Pandas and NumPy help analysts work efficiently with datasets.

By learning a combination of Excel, SQL, and Python, students can develop a flexible foundation.

Each tool has different strengths. Excel is useful for spreadsheet-based analysis, SQL is useful for retrieving database information, and Python can support automation and deeper analysis.

This combination helps professionals adapt to different types of analytical tasks.

Growing Demand for Business Intelligence

Business Intelligence is becoming increasingly important as organizations want faster access to information.

Instead of waiting for manual reports, companies use dashboards that display important metrics in an interactive format.

Power BI and Tableau are important tools for Business Intelligence and data visualization. These platforms allow users to connect data from different sources and create dashboards.

Managers can use dashboards to monitor KPIs and understand business performance.

For example, a sales dashboard may display total revenue, product performance, regional sales, monthly trends, and customer information.

An HR dashboard may provide insights into employee numbers, recruitment activity, attendance, and other metrics.

A financial dashboard may help organizations monitor revenue, expenses, and profitability.

Professionals who understand dashboard development and Business Intelligence concepts can therefore explore opportunities related to reporting and analytics.

Future Growth Through Advanced Analytics

A Data Analyst role can also provide a foundation for learning more advanced technologies.

After developing strong skills in data cleaning, SQL, Python, statistics, and visualization, learners may decide to explore advanced fields.

One possible direction is Data Science. Data Science involves deeper statistical analysis and predictive modeling.

Another area is Machine Learning. Machine Learning focuses on building models that can identify patterns and make predictions based on data.

For example, machine learning can be used for customer segmentation, sales forecasting, recommendation systems, and other predictive applications.

Learners may also explore Artificial Intelligence, particularly as AI tools become increasingly integrated into business processes.

Other advanced career paths include Data Engineering, where professionals focus on building systems and pipelines for collecting and processing data.

Business Intelligence specialists can also continue developing expertise in advanced reporting, data modeling, cloud platforms, and enterprise analytics systems.

Therefore, data analytics can serve as a strong starting point for several future technology careers.

Cloud-Based Analytics Opportunities

Cloud technology is becoming increasingly important in the data ecosystem.

Organizations often store and process information using cloud platforms because they provide flexibility and scalability.

As professionals gain experience, they may explore cloud-based data tools and platforms.

Cloud analytics can involve working with large datasets, databases, data warehouses, and Business Intelligence services.

Learning the fundamentals of data analytics first can make it easier to understand these advanced systems later.

A strong foundation in SQL, Python, data modeling, and analytics is useful when exploring cloud technologies.

Professionals can continue learning about cloud platforms and services based on their career interests and industry requirements.

Opportunities in Remote and Global Work

Digital technologies have created new ways for professionals to collaborate with teams located in different regions.

Data analysis work often involves digital tools, databases, dashboards, and cloud-based systems. This means that many analytics tasks can potentially be performed remotely depending on the organization and role.

Professionals with strong technical skills and a good portfolio can explore opportunities with companies beyond their immediate location.

Remote collaboration also makes communication skills important.

A Data Analyst must be able to explain findings clearly and share reports with team members.

Therefore, professionals who combine technical knowledge with communication and presentation skills may be better prepared for modern workplaces.

Freelancing and Independent Projects

Data analytics skills can also be useful for independent work and freelance projects.

Businesses may need help organizing spreadsheets, analyzing customer data, creating reports, building dashboards, or improving their data processes.

A professional with practical experience in Excel, SQL, Python, Power BI, or Tableau may eventually explore independent projects depending on their skills and opportunities.

Building a portfolio is particularly important for this type of work.

A portfolio can demonstrate completed projects and show potential clients or employers how an individual approaches data problems.

Examples of portfolio projects can include sales dashboards, customer analysis, HR analytics, financial reports, SQL case studies, and Python-based data analysis projects.

A strong portfolio helps demonstrate practical ability.

Data Analytics and Artificial Intelligence

Artificial Intelligence is expected to continue influencing the future of data-related careers.

AI tools can help automate certain tasks and make data analysis faster.

However, professionals will still need to understand the data being analyzed.

An analyst must be able to evaluate whether information is accurate, identify unusual patterns, understand business context, and communicate findings.

AI can assist with automation, but analytical thinking remains important.

Future Data Analysts may increasingly work alongside AI-powered tools.

Professionals who understand both data analytics and modern AI technologies may be able to adapt more effectively to changes in the technology landscape.

Learning the fundamentals of data analysis provides a useful foundation for understanding these tools.

The Importance of Analytical Thinking

The future of a Data Analyst is not based only on knowing software.

Tools can change over time, but analytical thinking remains valuable.

A strong analyst should know how to ask useful questions.

For example, instead of simply reporting that sales decreased, an analyst may investigate why sales decreased.

They may compare different regions, products, time periods, or customer groups.

Analytical thinking involves understanding the problem, exploring possible causes, evaluating evidence, and communicating conclusions.

These skills can remain useful even when organizations adopt new technologies.

Therefore, learners should focus on developing problem-solving abilities alongside technical skills.

Career Growth and Specialization

As professionals gain experience, they can specialize in particular areas.

A Data Analyst working in finance may develop expertise in financial reporting.

Someone working in marketing may specialize in campaign analytics and customer behavior.

Professionals in healthcare, retail, manufacturing, or e-commerce can develop domain-specific knowledge.

Specialization can help professionals understand the unique business challenges and metrics used in their industry.

Over time, professionals may move into senior analytics positions, Business Intelligence roles, analytics consulting, data science, or management positions.

Career growth depends on continuous learning, practical experience, communication skills, and the ability to solve business problems.

Building a Strong Portfolio for Future Opportunities

A portfolio can play an important role in demonstrating Data Analyst skills.

Students should aim to create projects using different tools.

An Excel project can demonstrate spreadsheet analysis and reporting.

A SQL project can demonstrate database querying skills.

A Python project can show data cleaning and exploratory analysis.

Power BI and Tableau projects can demonstrate dashboard development and visualization skills.

Each project should clearly explain the business problem, the dataset, the analysis performed, and the insights discovered.

This approach helps potential employers understand the practical abilities of the learner.

A portfolio can also help students track their own progress and identify areas where they need more practice.

Continuous Learning for Long-Term Growth

The data and technology industry continues to evolve.

New tools, platforms, and techniques are regularly introduced.

Therefore, professionals should develop a habit of continuous learning.

After completing a Data Analyst course, learners can continue improving their SQL and Python skills.

They can learn advanced Power BI concepts, advanced Tableau, data modeling, cloud platforms, or machine learning.

The important goal is to build a strong foundation first.

Once the fundamentals are understood, it becomes easier to learn advanced technologies.

Continuous practice is also essential because technical skills improve through regular use.

Conclusion

The future scope of data analytics is broad because organizations across industries continue to depend on information for decision-making.

The Data Analyst Certification Course in Mohali — 2026–27 Batch provides learners with a foundation in important areas such as Excel, SQL, Python, statistics, Power BI, Tableau, data cleaning, and visualization.

These skills can help learners prepare for roles such as Data Analyst, Reporting Analyst, MIS Analyst, Business Intelligence Analyst, and other analytics-related positions.

Data analytics also provides a foundation for advanced career paths in Data Science, Machine Learning, Artificial Intelligence, Data Engineering, Business Intelligence, and cloud analytics.

The future success of a Data Analyst will depend not only on learning software tools but also on developing analytical thinking, problem-solving, communication, and business understanding.

By continuously practicing, building projects, improving technical skills, and staying open to new technologies, learners can develop a strong foundation for long-term growth in the evolving world of data and analytics.

Data Analyst Certification Course in Mohali — 2026–27 Batch: Course Overview

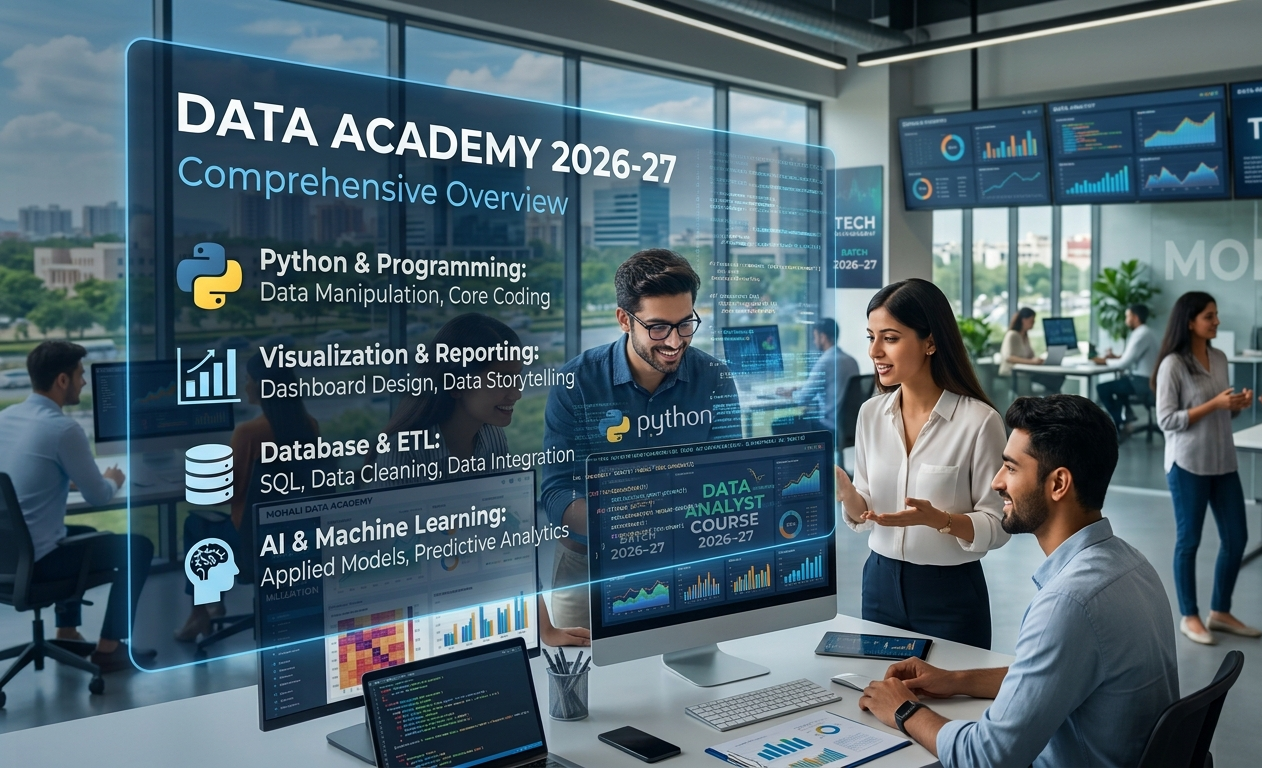
The Data Analyst Certification Course in Mohali — 2026–27 Batch is a comprehensive and career-focused training program designed for students, graduates, beginners, and working professionals who want to build strong skills in data analytics and business intelligence. In today's digital economy, data has become one of the most valuable resources for organizations. Every business generates data through customers, sales, operations, marketing campaigns, websites, financial transactions, and many other activities. However, raw data alone cannot help an organization make better decisions. Companies need skilled professionals who can collect, organize, clean, analyze, visualize, and interpret data. This is where the role of a Data Analyst becomes important.

This program is designed to provide learners with a structured path for developing practical Data Analyst skills. The course covers essential tools and technologies such as Microsoft Excel, SQL, Python, Statistics, Data Visualization, Power BI, and Tableau. Students learn not only how these tools work individually but also how they can be combined to solve real-world business problems. The training emphasizes practical exercises, assignments, case studies, dashboards, and portfolio projects so that learners can gain hands-on experience throughout their learning journey.

The 2026–27 Batch is suitable for individuals who want to start a career in data analytics as well as professionals who want to upgrade their existing skills. The course begins with fundamental concepts and gradually moves towards more advanced data analysis and business intelligence topics. This structured approach helps learners build confidence step by step, even if they are starting with limited technical knowledge.

Understanding Data Analytics and the Role of a Data Analyst

The course starts with an introduction to data analytics and its importance in modern organizations. Students learn what data analytics means and how companies use information to make strategic decisions. Different types of data, including structured and unstructured data, are introduced along with common sources of business data.

Learners also understand the complete data analytics process. This generally involves identifying a business problem, collecting relevant data, cleaning and preparing the data, analyzing it, finding patterns, creating visualizations, and communicating insights to stakeholders. Understanding this workflow is important because a Data Analyst is not simply responsible for creating charts. A successful analyst must understand the business problem and convert complex information into useful and understandable insights.

Students are also introduced to common roles related to analytics, including Data Analyst, Business Analyst, Reporting Analyst, MIS Analyst, Business Intelligence Analyst, and Data Scientist. This helps learners understand different career paths and identify the skills required for each role.

Microsoft Excel for Data Analysis

Microsoft Excel remains one of the most widely used tools for business reporting and data analysis. Therefore, the course provides practical training in Excel and its analytical capabilities. Students begin with basic spreadsheet concepts and gradually move towards advanced formulas, functions, reporting, and dashboard development.

The Excel module covers commonly used mathematical, statistical, logical, text, date, and lookup functions. Students learn how to work with functions such as IF, SUMIF, COUNTIF, AVERAGEIF, XLOOKUP, INDEX, MATCH, and other functions used for business analysis.

Data cleaning and formatting techniques are also covered. Students learn how to identify duplicate values, manage missing information, clean text, standardize data formats, and organize datasets for analysis.

One of the most important topics in Excel analytics is the use of Pivot Tables and Pivot Charts. Students learn how to summarize large datasets and identify trends across different categories. Interactive reports can be created using filters, slicers, and charts. These skills are highly useful for creating management reports and business dashboards.

By completing the Excel module, learners gain the ability to perform practical data analysis tasks using spreadsheets and communicate findings through organized reports and visualizations.

SQL and Database Analytics

SQL is an essential skill for many Data Analyst roles because organizations often store large volumes of information in databases. The course introduces students to relational databases and teaches them how to retrieve and analyze information using Structured Query Language.

Students begin with basic SQL queries, including SELECT statements, filtering data using WHERE clauses, sorting results, and limiting records. They then progress towards aggregate functions such as SUM, COUNT, AVG, MIN, and MAX.

Grouping and summarizing data using GROUP BY and HAVING clauses are important parts of the training. Students learn how to analyze sales, customers, transactions, and other business information by creating meaningful summaries.

SQL joins are covered in detail because real-world databases often contain information distributed across multiple tables. Students learn concepts such as INNER JOIN, LEFT JOIN, RIGHT JOIN, and other techniques for combining related datasets.

The course also introduces subqueries, Common Table Expressions, and advanced SQL concepts. Learners practice writing queries that solve realistic analytical problems. Through regular exercises, students develop confidence in extracting useful information from databases.

Python for Data Analysis

Python has become one of the most popular programming languages for data analysis. The course introduces Python in a beginner-friendly manner so that learners can understand programming concepts before using Python for analytics.

Students learn variables, data types, operators, conditional statements, loops, functions, and other basic programming concepts. These fundamentals help learners understand how Python programs work.

After building a foundation in Python, students are introduced to important data analysis libraries. NumPy is used for numerical operations and working with arrays, while Pandas is used extensively for handling datasets.

Using Pandas, students learn how to load data from files, inspect datasets, select rows and columns, filter records, sort information, group data, merge datasets, and perform calculations. Data cleaning techniques are also practiced using Python.

Students learn how to identify missing values, handle duplicates, convert data types, clean text, and prepare datasets for further analysis. These skills are important because real-world datasets are often incomplete or inconsistent.

The Python module helps learners understand how programming can automate analytical tasks and support deeper exploration of data.

Statistics and Analytical Thinking

Statistics is an important part of data analytics because it helps professionals understand and interpret information accurately. The course covers practical statistical concepts that are useful for Data Analysts.

Students learn about measures of central tendency such as mean, median, and mode. They also study variance, standard deviation, and other concepts that help measure data distribution and variability.

Correlation is introduced to help learners understand relationships between variables. Students learn how to interpret positive, negative, and weak relationships between different data points.

Basic probability concepts are also included to help learners understand uncertainty and patterns. The course may also introduce hypothesis testing concepts to help learners understand how analysts use data to evaluate assumptions.

The focus remains on practical understanding rather than unnecessarily complex mathematical theory. Students learn how statistical concepts can help them make better decisions while analyzing business datasets.

Data Visualization and Storytelling

Data visualization is one of the most important skills for a Data Analyst. Even a detailed analysis may not be useful if the results are difficult to understand. Visualizations help convert complex data into clear and meaningful information.

The course introduces students to important visualization principles and teaches them how to select appropriate charts based on the data and business question.

Learners practice creating bar charts, line charts, pie charts, histograms, scatter plots, box plots, and other visualization types. Python libraries such as Matplotlib and Seaborn are used to create professional visualizations.

Students also learn about data storytelling. Instead of simply creating charts, learners understand how to communicate the main message behind the data. They learn how to identify important insights, explain trends, highlight unusual patterns, and present recommendations.

This skill is valuable because Data Analysts frequently communicate their findings to managers and other stakeholders who may not have a technical background.

Power BI for Business Intelligence

Power BI is an important Business Intelligence platform used for creating interactive dashboards and reports. The course provides practical training in Power BI and introduces students to the complete dashboard development process.

Students learn how to import data from different sources and transform data using Power Query. Data cleaning, filtering, merging, and transformation techniques are practiced before building reports.

The course also covers data modeling concepts. Students learn how tables are connected through relationships and how a well-designed data model can support accurate reporting.

DAX is introduced for creating calculated columns and measures. Students learn how to perform calculations and create business metrics that can be displayed in reports.

Interactive dashboards are created using charts, KPIs, cards, slicers, filters, and other visual components. Students learn how to design reports that are clear, interactive, and useful for decision-making.

Power BI projects help learners understand how organizations use dashboards to monitor sales performance, customer behavior, employee metrics, financial performance, and other important business indicators.

Tableau for Data Visualization

Tableau is another important tool covered in the Data Analyst Certification Course. It is widely used for creating interactive visualizations and business dashboards.

Students learn how to connect Tableau with datasets and explore information through visual analysis. Different types of charts and graphs are created based on business requirements.

The Tableau module includes calculated fields, filters, parameters, dashboards, and interactive reporting features. Students also learn how to organize multiple visualizations into a single dashboard.

Through practical exercises, learners understand how to present analytical findings in a visually engaging and professional format.

Learning both Power BI and Tableau provides students with exposure to major Business Intelligence tools and helps them understand different approaches to dashboard development.

Data Cleaning and Exploratory Data Analysis

Data cleaning is a critical part of every analytics project. Raw data may contain missing values, duplicate records, inconsistent formats, incorrect information, and outliers.

The course teaches students how to identify these problems and apply appropriate cleaning techniques. Learners practice cleaning data using Excel, SQL, Python, and Business Intelligence tools.

Exploratory Data Analysis is also an important part of the course. Students learn how to investigate a dataset before performing deeper analysis. They examine distributions, identify trends, compare categories, and explore relationships between variables.

This process helps analysts understand the data and discover useful patterns. Learners practice asking important questions such as which products perform best, which regions generate the highest sales, which customers are most valuable, and where business performance can improve.

Real-World Projects and Portfolio Development

Practical projects are an important component of the Data Analyst Certification Course. Students work with realistic datasets and apply multiple skills learned during the program.

Projects may focus on areas such as sales analysis, customer analytics, HR analytics, marketing performance, financial analysis, and business intelligence dashboards.

Students use tools such as Excel, SQL, Python, Power BI, and Tableau to complete different stages of an analysis. They learn how to define a problem, clean data, perform analysis, create visualizations, and present insights.

Portfolio development is also encouraged. A strong portfolio can help students demonstrate practical abilities beyond theoretical knowledge. Learners can showcase dashboards, SQL projects, Python notebooks, reports, and case studies.

Career Preparation and Professional Skills

The Data Analyst Certification Course also helps learners prepare for professional opportunities. Students can practice explaining their projects and understanding common analytical questions.

Technical skills are important, but communication is also essential. Data Analysts must be able to explain their findings clearly to business stakeholders. The course encourages learners to improve analytical thinking, problem-solving, presentation, and communication skills.

Students can also learn how to organize their professional portfolio and demonstrate their technical knowledge through practical work.

Conclusion

The Data Analyst Certification Course in Mohali — 2026–27 Batch provides a structured and practical pathway for individuals who want to build a foundation in data analytics. The program covers essential tools such as Excel, SQL, Python, Statistics, Power BI, Tableau, and Data Visualization.

Through hands-on exercises, assignments, business case studies, dashboards, and portfolio projects, learners gain practical exposure to the data analytics workflow. The course is suitable for beginners as well as individuals who want to upgrade their professional skills.

By completing the training and consistently practicing the concepts, students can develop the technical knowledge and analytical mindset required to explore opportunities in the growing field of data analytics and business intelligence.

Why Choose Techcadd for the Data Analyst Certification Course in Mohali?

Choosing the right training institute is an important decision for anyone planning to build a career in data analytics. Learning a few tools alone is not enough to become confident in working with real-world data. A good Data Analyst training program should provide a structured learning path, practical assignments, industry-relevant tools, project experience, analytical thinking, and guidance for career preparation. The Data Analyst Certification Course in Mohali — 2026–27 Batch at Techcadd is designed with these requirements in mind.

Techcadd focuses on helping learners move from basic concepts to practical data analysis skills through a structured and hands-on learning approach. The course is suitable for students, graduates, beginners, and working professionals who want to learn how data is collected, cleaned, analyzed, visualized, and converted into meaningful business insights. Instead of focusing only on theoretical concepts, the training emphasizes practical exercises and projects that allow students to apply their learning.

Structured Learning Path from Beginner to Advanced Concepts

One of the important reasons to choose Techcadd is the structured learning journey provided to students. Data analytics involves multiple tools and concepts, and beginners can sometimes feel confused about where to start.

The program begins with the fundamental concepts of data analytics and gradually introduces the tools used by Data Analysts. Students first understand the role of data in business and how organizations use information for decision-making. They then move towards practical tools such as Microsoft Excel, SQL, Python, Power BI, Tableau, statistics, and data visualization.

This step-by-step approach allows learners to develop their knowledge gradually. Instead of immediately working with advanced concepts, students first build a strong foundation. This makes the learning process more comfortable and helps students understand how different analytics tools work together.

The goal is to create a clear roadmap so that learners know what they are learning, why they are learning it, and where the skill can be applied.

Practical Learning with Industry-Relevant Tools

A Data Analyst needs to be comfortable working with different tools depending on the type of data and business problem. Techcadd's Data Analyst training focuses on important technologies commonly used for analytics and reporting.

Students learn Microsoft Excel for data organization, formulas, functions, reporting, Pivot Tables, charts, and dashboard development. Excel remains an important tool in many organizations because it is widely used for business reporting and quick data analysis.

SQL training helps students understand how to work with data stored in databases. Learners practice writing queries to select, filter, group, summarize, and combine information from multiple tables.

Python is introduced for data analysis and automation. Students learn how to work with datasets using libraries such as NumPy and Pandas. They also explore data cleaning, transformation, exploratory analysis, and visualization.

Business Intelligence tools such as Power BI and Tableau are included to help students build professional dashboards and reports. Learning multiple tools gives students broader exposure to the analytics ecosystem.

Hands-On Exercises and Regular Practice

Learning data analytics requires practice. Reading about SQL queries or Power BI dashboards is useful, but real improvement happens when students work directly with data.

Techcadd focuses on practical learning through exercises and assignments. Students are encouraged to practice concepts after learning them and apply their knowledge to different datasets.

For example, while learning Excel, students can work with formulas, Pivot Tables, charts, and business reports. During SQL training, they practice queries that solve analytical problems. Python learners work with datasets to perform cleaning and analysis tasks.

Power BI and Tableau training includes dashboard development and interactive reporting exercises. This continuous practice helps learners become more comfortable with the tools.

Hands-on learning also helps students identify their weak areas. When learners work with real datasets, they encounter missing values, duplicates, formatting problems, and unexpected results. Solving these challenges improves analytical thinking and practical confidence.

Learning How to Work with Realistic Data

Real-world data is rarely perfectly organized. A dataset may contain missing information, duplicate records, inconsistent formats, incorrect values, or unnecessary columns.

Techcadd emphasizes the importance of data cleaning and preparation. Students learn how to identify problems in a dataset and prepare information before analysis.

Learners practice techniques such as handling missing values, identifying duplicates, correcting data formats, filtering information, transforming columns, and organizing datasets.

Understanding data preparation is an important skill because the quality of analysis depends heavily on the quality of the data being used. A visually attractive dashboard can still produce misleading results if the underlying data has not been properly checked.

By practicing with different datasets, students develop the habit of exploring and understanding information before drawing conclusions.

Strong Focus on Data Visualization

Data analysis is not only about calculations and queries. Analysts must also communicate their findings clearly.

Techcadd helps students understand data visualization and dashboard development. Learners explore different chart types and understand when each visualization should be used.

Students learn how to create bar charts, line charts, pie charts, scatter plots, histograms, and other visual representations of information. They also learn how to organize dashboards so that important information can be understood easily.

Power BI and Tableau allow learners to create interactive reports using filters, slicers, KPIs, charts, and other visual components.

The focus is not simply on creating colorful dashboards. Students are encouraged to think about the business question behind the visualization. They learn how to identify important metrics and present information in a way that supports decision-making.

This approach helps learners develop data storytelling skills, which are valuable when presenting analytical findings to managers and stakeholders.

Project-Based Learning Experience

Projects are an important part of developing practical Data Analyst skills. A project allows students to combine multiple concepts and tools while solving a complete analytical problem.

Techcadd encourages learners to work on projects based on different business areas. Students may analyze sales performance, customer behavior, employee information, marketing results, financial data, or other business datasets.

A typical project may involve several stages. Students first understand the business problem and explore the available data. They then clean and prepare the information, perform analysis, identify trends, and create visualizations or dashboards.

This process helps learners understand the complete data analytics workflow.

Projects can also help students build a professional portfolio. Instead of simply saying that they know a particular tool, learners can demonstrate their skills through completed dashboards, SQL queries, Python analysis notebooks, and reports.

A portfolio can be useful when preparing for interviews and demonstrating practical knowledge.

Excel Training for Business Reporting

Microsoft Excel continues to play an important role in business analytics. Many companies use Excel for reporting, calculations, data organization, and quick analysis.

The training helps students move beyond basic spreadsheet usage. Learners explore important functions, lookup formulas, logical functions, conditional formatting, data validation, Pivot Tables, and Pivot Charts.

Students also learn how to create reports that summarize large amounts of information.

Interactive reporting features such as filters and slicers can help users explore information more efficiently.

These Excel skills are useful not only for Data Analyst roles but also for many business and reporting positions.

SQL Skills for Database Analysis

SQL is one of the most important technical skills for many analytics roles.

Organizations often store information in relational databases, and Data Analysts need to retrieve the required information for analysis.

Techcadd provides structured SQL training that begins with basic queries and gradually introduces advanced concepts.

Students learn SELECT statements, filtering, sorting, aggregate functions, GROUP BY, HAVING clauses, joins, subqueries, Common Table Expressions, and other useful concepts.

The focus is on understanding how SQL can be used to answer business questions.

For example, learners may practice identifying the highest-performing products, calculating total sales, comparing regions, analyzing customer activity, or finding trends across different periods.

Regular SQL practice helps students become more comfortable with writing queries and understanding database structures.

Python for Advanced Data Analysis

Python provides additional capabilities for Data Analysts who want to perform deeper data analysis or automate repetitive tasks.

The course introduces Python in a beginner-friendly way so that students can understand programming fundamentals before working with analytical libraries.

Students learn variables, data types, conditions, loops, functions, and other important programming concepts.

They then use libraries such as NumPy and Pandas to work with datasets.

Pandas allows analysts to load data, inspect datasets, select columns, filter records, group information, merge tables, and perform calculations.

Students also learn data cleaning techniques using Python.

This combination of programming and analytics helps learners understand how code can be used to process larger datasets and automate certain tasks.

Power BI for Professional Dashboards

Power BI is a widely used Business Intelligence tool for creating interactive reports and dashboards.

Techcadd's training helps students understand the complete Power BI workflow.

Students learn how to import data, clean and transform information using Power Query, build data models, create relationships, and develop calculated measures.

DAX concepts are introduced to help learners create important business calculations.

Students then create interactive dashboards using KPIs, cards, charts, tables, slicers, and filters.

Power BI projects help learners understand how businesses monitor sales, customer activity, employee performance, financial results, and other key metrics.

The goal is to help students create dashboards that are not only visually appealing but also useful for decision-making.

Tableau for Interactive Visualization

Tableau is another important Business Intelligence and visualization platform included in the learning journey.

Students learn how to connect datasets and create different visualizations.

The training covers charts, filters, calculated fields, parameters, dashboards, and interactive reporting.

Learning Tableau provides additional exposure to professional visualization tools and helps students understand different approaches to business reporting.

Students can compare different tools and develop confidence in adapting to new analytics platforms.

Statistics for Better Analytical Decisions

Statistics helps Data Analysts understand the meaning behind data.

Techcadd introduces important statistical concepts that are useful for practical analytics.

Students learn measures such as mean, median, mode, variance, and standard deviation.

They also explore correlation and relationships between variables.

These concepts help analysts understand data distributions and patterns.

The focus is on applying statistical concepts to real datasets rather than simply memorizing formulas.

Learners understand how statistics can support better interpretation and help avoid incorrect conclusions.

Development of Analytical and Problem-Solving Skills

A successful Data Analyst needs more than technical knowledge.

Analytical thinking is important because professionals must understand business problems and determine what information is required to answer them.

Techcadd encourages learners to ask questions while working with datasets.

Instead of simply creating charts, students learn to investigate why a particular trend exists and what factors may be influencing it.

For example, if sales decrease in a particular region, an analyst may investigate product performance, customer behavior, seasonal trends, or other factors.

This problem-solving approach helps students move from simply using tools to thinking like analysts.

Portfolio Development and Career Preparation

A strong portfolio can help students demonstrate practical abilities.

Techcadd encourages learners to organize their completed projects and analytical work.

Students can showcase Excel reports, SQL projects, Python notebooks, Power BI dashboards, and Tableau visualizations.

Each project can demonstrate a different aspect of their skills.

Career preparation also involves understanding how to explain projects clearly.

Students should be able to describe the problem they worked on, the data they used, the tools involved, the analysis performed, and the insights discovered.

This ability to communicate technical work clearly is important during interviews.

Suitable for Different Types of Learners

The Data Analyst Certification Course is designed for different types of learners.

College students can develop additional practical skills alongside their academic education.

Graduates can use the course to build a stronger portfolio and explore analytics careers.

Beginners can start with fundamental concepts and gradually move towards technical tools.

Working professionals can upgrade their skills and explore opportunities related to analytics and business intelligence.

The structured learning path makes it easier for learners from different backgrounds to understand the subject.

Continuous Learning Mindset

The technology and data landscape continues to evolve.

Therefore, learning does not stop after completing a course.

Techcadd encourages students to develop a continuous learning mindset.

Once learners build a strong foundation in Excel, SQL, Python, Power BI, Tableau, and analytics concepts, they can continue exploring advanced technologies.

Possible learning paths include advanced SQL, machine learning, cloud analytics, data engineering, business intelligence, and artificial intelligence.

A strong foundation in data analytics makes it easier to explore these advanced areas in the future.

Conclusion

The Data Analyst Certification Course in Mohali — 2026–27 Batch at Techcadd is designed to provide a practical and structured learning experience for individuals interested in data analytics.

The course combines important technologies such as Excel, SQL, Python, Statistics, Power BI, Tableau, Data Visualization, and Data Cleaning.

Students gain practical experience through exercises, assignments, dashboards, case studies, and projects.

The focus on analytical thinking, data preparation, visualization, and portfolio development helps learners understand the complete analytics workflow.

Whether you are a student, graduate, beginner, or working professional, the program provides an opportunity to develop valuable analytical skills and build a foundation for future growth in data analytics and business intelligence.

Future Scope of Data Analytics and Career Opportunities

The future scope of data analytics is growing rapidly as organizations across the world increasingly depend on data to make better business decisions. Every day, businesses generate enormous amounts of information through customer interactions, websites, mobile applications, online transactions, social media, marketing campaigns, financial systems, and operational processes. However, collecting large amounts of information is not enough. Organizations need skilled professionals who can organize, clean, analyze, interpret, and present data in a meaningful way. This increasing dependence on data has created strong opportunities for professionals with practical data analytics skills.

The Data Analyst Certification Course in Mohali — 2026–27 Batch is designed to help learners build a strong foundation in important analytics tools and concepts. By learning technologies such as Excel, SQL, Python, Power BI, Tableau, statistics, and data visualization, students can prepare themselves for a wide range of analytical roles and future career paths.

Data analytics is not limited to a single industry. Almost every modern organization uses data to understand its customers, measure performance, improve operations, and identify opportunities. This means that professionals with strong analytical skills can explore opportunities across different sectors and continue developing their careers as technology evolves.

Growing Importance of Data in Business

Businesses today make many important decisions based on data. Companies analyze sales performance to understand which products are performing well. Marketing teams study campaign results to identify which strategies generate better engagement. Financial organizations use data to monitor transactions and identify patterns. Healthcare organizations analyze information to improve services and operations.

Because of this growing use of information, the role of a Data Analyst has become increasingly important. A Data Analyst helps transform raw information into useful insights that can support decision-making.

For example, a business may have thousands of customer transactions stored in a database. Without analysis, it may be difficult to understand which products are popular, which locations perform well, or which customers contribute the most revenue.

A Data Analyst can use SQL, Excel, Python, Power BI, or Tableau to organize this information and answer important questions.

As more organizations adopt digital systems, the volume of available data is likely to continue increasing. This creates a long-term need for professionals who understand how to work with information effectively.

Career Opportunities After Learning Data Analytics

After developing strong practical skills, learners can explore different career paths related to data, reporting, and business intelligence.

One of the most common roles is Data Analyst. Data Analysts collect, clean, analyze, and interpret information. They create reports and dashboards that help organizations understand performance and identify important trends.

Another possible role is Business Intelligence Analyst. Professionals in this area focus on business reporting and dashboard development. They may work with Business Intelligence tools to create interactive reports for managers and decision-makers.

Learners can also explore Reporting Analyst positions. Reporting Analysts prepare regular reports that help organizations monitor important metrics such as sales, revenue, customer activity, employee performance, and operational results.

An MIS Analyst is another possible career path. MIS professionals often manage reports and information systems used by organizations for internal decision-making.

With additional business and communication skills, learners may also explore the role of Business Analyst. Business Analysts focus on understanding business problems, gathering requirements, analyzing processes, and supporting improvements.

Other opportunities may include junior analytics roles, data operations positions, dashboard development roles, and analytics consulting positions.

The exact responsibilities of these roles may differ from one organization to another, but strong skills in data analysis, reporting, visualization, and problem-solving can provide a valuable foundation.

Opportunities Across Multiple Industries

One of the biggest advantages of learning data analytics is that the skills can be applied across different industries.

The IT industry uses data analytics for software performance, customer insights, product analysis, and business reporting.

The banking and financial sector uses data to monitor transactions, understand customer behavior, analyze financial performance, and identify unusual patterns.

The healthcare industry uses information to study operational performance, patient services, resource utilization, and other important areas.

E-commerce companies analyze customer purchases, product performance, website activity, and marketing results.

The retail industry uses analytics to understand customer preferences, manage inventory, and analyze sales trends.

Manufacturing organizations analyze operational information to improve efficiency and monitor production processes.

The education sector can use analytics to understand student performance, course engagement, and institutional operations.

Marketing and advertising organizations also rely heavily on data to understand campaign performance and customer engagement.

Because analytical skills are useful in so many industries, Data Analysts are not restricted to one particular domain. Professionals can develop industry-specific knowledge over time and specialize in areas that interest them.

The Importance of Excel, SQL, and Python

The future of a Data Analyst depends on building a combination of practical skills rather than relying on only one tool.

Excel continues to be useful for business reporting, calculations, quick analysis, and data organization. Many companies continue to use spreadsheets as part of their daily workflow.

SQL is highly valuable because databases are used by organizations to store structured information. Analysts who understand SQL can retrieve and analyze information directly from databases.

Python provides additional capabilities for data cleaning, automation, analysis, and visualization. Libraries such as Pandas and NumPy help analysts work efficiently with datasets.

By learning a combination of Excel, SQL, and Python, students can develop a flexible foundation.

Each tool has different strengths. Excel is useful for spreadsheet-based analysis, SQL is useful for retrieving database information, and Python can support automation and deeper analysis.

This combination helps professionals adapt to different types of analytical tasks.

Growing Demand for Business Intelligence

Business Intelligence is becoming increasingly important as organizations want faster access to information.

Instead of waiting for manual reports, companies use dashboards that display important metrics in an interactive format.

Power BI and Tableau are important tools for Business Intelligence and data visualization. These platforms allow users to connect data from different sources and create dashboards.

Managers can use dashboards to monitor KPIs and understand business performance.

For example, a sales dashboard may display total revenue, product performance, regional sales, monthly trends, and customer information.

An HR dashboard may provide insights into employee numbers, recruitment activity, attendance, and other metrics.

A financial dashboard may help organizations monitor revenue, expenses, and profitability.

Professionals who understand dashboard development and Business Intelligence concepts can therefore explore opportunities related to reporting and analytics.

Future Growth Through Advanced Analytics

A Data Analyst role can also provide a foundation for learning more advanced technologies.

After developing strong skills in data cleaning, SQL, Python, statistics, and visualization, learners may decide to explore advanced fields.

One possible direction is Data Science. Data Science involves deeper statistical analysis and predictive modeling.

Another area is Machine Learning. Machine Learning focuses on building models that can identify patterns and make predictions based on data.

For example, machine learning can be used for customer segmentation, sales forecasting, recommendation systems, and other predictive applications.

Learners may also explore Artificial Intelligence, particularly as AI tools become increasingly integrated into business processes.

Other advanced career paths include Data Engineering, where professionals focus on building systems and pipelines for collecting and processing data.

Business Intelligence specialists can also continue developing expertise in advanced reporting, data modeling, cloud platforms, and enterprise analytics systems.

Therefore, data analytics can serve as a strong starting point for several future technology careers.

Cloud-Based Analytics Opportunities

Cloud technology is becoming increasingly important in the data ecosystem.

Organizations often store and process information using cloud platforms because they provide flexibility and scalability.

As professionals gain experience, they may explore cloud-based data tools and platforms.

Cloud analytics can involve working with large datasets, databases, data warehouses, and Business Intelligence services.

Learning the fundamentals of data analytics first can make it easier to understand these advanced systems later.

A strong foundation in SQL, Python, data modeling, and analytics is useful when exploring cloud technologies.

Professionals can continue learning about cloud platforms and services based on their career interests and industry requirements.

Opportunities in Remote and Global Work

Digital technologies have created new ways for professionals to collaborate with teams located in different regions.

Data analysis work often involves digital tools, databases, dashboards, and cloud-based systems. This means that many analytics tasks can potentially be performed remotely depending on the organization and role.

Professionals with strong technical skills and a good portfolio can explore opportunities with companies beyond their immediate location.

Remote collaboration also makes communication skills important.

A Data Analyst must be able to explain findings clearly and share reports with team members.

Therefore, professionals who combine technical knowledge with communication and presentation skills may be better prepared for modern workplaces.

Freelancing and Independent Projects

Data analytics skills can also be useful for independent work and freelance projects.

Businesses may need help organizing spreadsheets, analyzing customer data, creating reports, building dashboards, or improving their data processes.

A professional with practical experience in Excel, SQL, Python, Power BI, or Tableau may eventually explore independent projects depending on their skills and opportunities.

Building a portfolio is particularly important for this type of work.

A portfolio can demonstrate completed projects and show potential clients or employers how an individual approaches data problems.

Examples of portfolio projects can include sales dashboards, customer analysis, HR analytics, financial reports, SQL case studies, and Python-based data analysis projects.

A strong portfolio helps demonstrate practical ability.

Data Analytics and Artificial Intelligence

Artificial Intelligence is expected to continue influencing the future of data-related careers.

AI tools can help automate certain tasks and make data analysis faster.

However, professionals will still need to understand the data being analyzed.

An analyst must be able to evaluate whether information is accurate, identify unusual patterns, understand business context, and communicate findings.

AI can assist with automation, but analytical thinking remains important.

Future Data Analysts may increasingly work alongside AI-powered tools.

Professionals who understand both data analytics and modern AI technologies may be able to adapt more effectively to changes in the technology landscape.

Learning the fundamentals of data analysis provides a useful foundation for understanding these tools.

The Importance of Analytical Thinking

The future of a Data Analyst is not based only on knowing software.

Tools can change over time, but analytical thinking remains valuable.

A strong analyst should know how to ask useful questions.

For example, instead of simply reporting that sales decreased, an analyst may investigate why sales decreased.

They may compare different regions, products, time periods, or customer groups.

Analytical thinking involves understanding the problem, exploring possible causes, evaluating evidence, and communicating conclusions.

These skills can remain useful even when organizations adopt new technologies.

Therefore, learners should focus on developing problem-solving abilities alongside technical skills.

Career Growth and Specialization

As professionals gain experience, they can specialize in particular areas.

A Data Analyst working in finance may develop expertise in financial reporting.

Someone working in marketing may specialize in campaign analytics and customer behavior.

Professionals in healthcare, retail, manufacturing, or e-commerce can develop domain-specific knowledge.

Specialization can help professionals understand the unique business challenges and metrics used in their industry.

Over time, professionals may move into senior analytics positions, Business Intelligence roles, analytics consulting, data science, or management positions.

Career growth depends on continuous learning, practical experience, communication skills, and the ability to solve business problems.

Building a Strong Portfolio for Future Opportunities

A portfolio can play an important role in demonstrating Data Analyst skills.

Students should aim to create projects using different tools.

An Excel project can demonstrate spreadsheet analysis and reporting.

A SQL project can demonstrate database querying skills.

A Python project can show data cleaning and exploratory analysis.

Power BI and Tableau projects can demonstrate dashboard development and visualization skills.

Each project should clearly explain the business problem, the dataset, the analysis performed, and the insights discovered.

This approach helps potential employers understand the practical abilities of the learner.

A portfolio can also help students track their own progress and identify areas where they need more practice.

Continuous Learning for Long-Term Growth

The data and technology industry continues to evolve.

New tools, platforms, and techniques are regularly introduced.

Therefore, professionals should develop a habit of continuous learning.

After completing a Data Analyst course, learners can continue improving their SQL and Python skills.

They can learn advanced Power BI concepts, advanced Tableau, data modeling, cloud platforms, or machine learning.

The important goal is to build a strong foundation first.

Once the fundamentals are understood, it becomes easier to learn advanced technologies.

Continuous practice is also essential because technical skills improve through regular use.

Conclusion

The future scope of data analytics is broad because organizations across industries continue to depend on information for decision-making.

The Data Analyst Certification Course in Mohali — 2026–27 Batch provides learners with a foundation in important areas such as Excel, SQL, Python, statistics, Power BI, Tableau, data cleaning, and visualization.

These skills can help learners prepare for roles such as Data Analyst, Reporting Analyst, MIS Analyst, Business Intelligence Analyst, and other analytics-related positions.

Data analytics also provides a foundation for advanced career paths in Data Science, Machine Learning, Artificial Intelligence, Data Engineering, Business Intelligence, and cloud analytics.

The future success of a Data Analyst will depend not only on learning software tools but also on developing analytical thinking, problem-solving, communication, and business understanding.

By continuously practicing, building projects, improving technical skills, and staying open to new technologies, learners can develop a strong foundation for long-term growth in the evolving world of data and analytics.

4.8
14 reviews
5
11
4
3
3
0
2
0
1
0
A
Aarav Bansal

The Excel and SQL modules were very practical and easy to understand. The dashboard projects helped me build confidence in working with real business data.

S
Simran Kaur

I joined as a beginner and gradually learned Python, Power BI and Tableau. The hands-on assignments helped me understand how a Data Analyst actually works.

R
Rohan Mehta

The course follows a proper learning path from Excel to advanced analytics tools. The project work was especially useful for improving my portfolio.

I
Ishita Arora

The trainers explained SQL joins and Power BI concepts clearly. I liked the practical approach and regular exercises after each important topic.

K
Kunal Sethi

The Data Analyst course gave me a good understanding of data cleaning, analysis and dashboard development. The projects were useful for interview preparation.

T
Tanvi Kapoor

Power BI was my favorite part of the course. I learned how to create KPIs, reports and interactive dashboards using different datasets.

M
Manav Chawla

The combination of Excel, SQL and Python made the course very useful. I now feel more confident while solving data analysis problems.

N
Naina Malhotra

Good learning experience for beginners. The practical assignments helped me improve my understanding of formulas, SQL queries and data visualization.

H
Harsh Vohra

The capstone project helped me combine different tools and create a complete analysis. It was a valuable experience for building my portfolio.

R
Ritika Sood

I appreciated the focus on practical dashboards and business datasets. The course helped me understand how to present insights clearly.

D
Devansh Khanna

The SQL training was detailed and included many practice queries. Learning joins, subqueries and window functions improved my analytical skills.

P
Palak Bedi

The Python data analysis module was explained step by step. Pandas and data cleaning exercises were particularly helpful for me.

Y
Yuvraj Oberoi

The overall course structure was good and covered the main Data Analyst tools. The regular project work made learning more interesting.

A
Aditi Narang

The course helped me understand how Excel, SQL, Python and Power BI can work together in data analysis projects. Great practical exposure.

Frequently Asked Questions

1 Who can join the Data Analyst Certification Course?

Students, graduates, beginners and working professionals can join this course. No advanced technical background is required because the program starts with fundamental concepts.

2 Do I need programming knowledge to become a Data Analyst?

No prior programming experience is necessary for beginners. Python concepts are taught step by step so students can gradually learn programming for data analysis.

3 Which tools will I learn in this Data Analyst course?

The course covers major analytics tools such as Microsoft Excel, SQL, Python, Pandas, Power BI and Tableau. Students also learn statistics and data visualization concepts.

4 Is SQL important for a Data Analyst job?

Yes, SQL is one of the most important skills for Data Analysts. It helps professionals extract, filter, combine and analyze data stored in databases.

5 Will I learn Power BI from basic to advanced level?

Yes, students start with Power BI fundamentals and gradually learn Power Query, data modeling, DAX, KPIs and interactive dashboard development.

6 What type of projects will I create during the course?

Students work on projects related to sales analysis, customer behavior, HR analytics, finance and business dashboards. These projects can also support portfolio development.

7 How long does it take to learn Data Analytics?

Learning time depends on your practice and previous knowledge. With consistent learning, students can build a strong foundation by completing the structured course modules and projects.

8 Is Excel still useful for Data Analysts?

Yes, Excel remains widely used for reporting, data cleaning and quick business analysis. Advanced Excel skills are valuable alongside SQL, Python and BI tools.

9 What is the difference between a Data Analyst and a Data Scientist?

Data Analysts mainly focus on analyzing existing data, reports and dashboards. Data Scientists generally work more deeply with predictive models, machine learning and advanced statistical techniques.

10 Can I learn Data Analytics while working full-time?

Yes, working professionals can learn data analytics through a structured schedule and regular practice. Consistent hands-on learning is important for developing practical skills.

11 Will I receive a certificate after completing the course?

Students who successfully complete the course requirements can receive a course completion certificate. The value of the certificate is strengthened when supported by practical skills and projects.

12 Is statistics difficult for beginners?

Basic statistics can be learned gradually with practical examples. The course focuses on concepts that are useful for understanding datasets and making analytical decisions.

13 How can I build a Data Analyst portfolio?

A strong portfolio can include Excel reports, SQL case studies, Python analysis notebooks and Power BI or Tableau dashboards. Projects should clearly explain the problem, analysis and insights.

14 What should I learn after becoming a Data Analyst?

After mastering core analytics skills, you can explore advanced SQL, machine learning, data engineering, cloud platforms or business intelligence specialization depending on your career goals.

Ready to Launch Your Career in Data Analyst Certification Course in Mohali — 2026–27 Batch?

Join Techcadd Mohali and learn from industry experts with hands-on projects, live training, and dedicated placement support.

Book Your Free Demo
WhatsApp
✨ Gini AI asks:

What is the difference between Web Dev & AI courses?

👋