Learn from certified professionals at TechcaddMohali with real industry experience in Web Development, AI, and Digital Marketing.
Get full-time support, career guidance, and doubt-clearing sessions to help you grow faster in your IT journey.
TechcaddMohali offers affordable, industry-ready training programs with live projects and 100% placement support.


We collaborate with top IT companies and universities to deliver industry-relevant learning and placement opportunities.

Learn AI tools & smart system development.

Build Android & iOS apps with real projects.

Master cloud computing with AWS services.

Learn ethical hacking & network security.

Work with Excel, SQL & data visualization.

SEO, social media & online ads in one course.
Python, ML models & big data training.

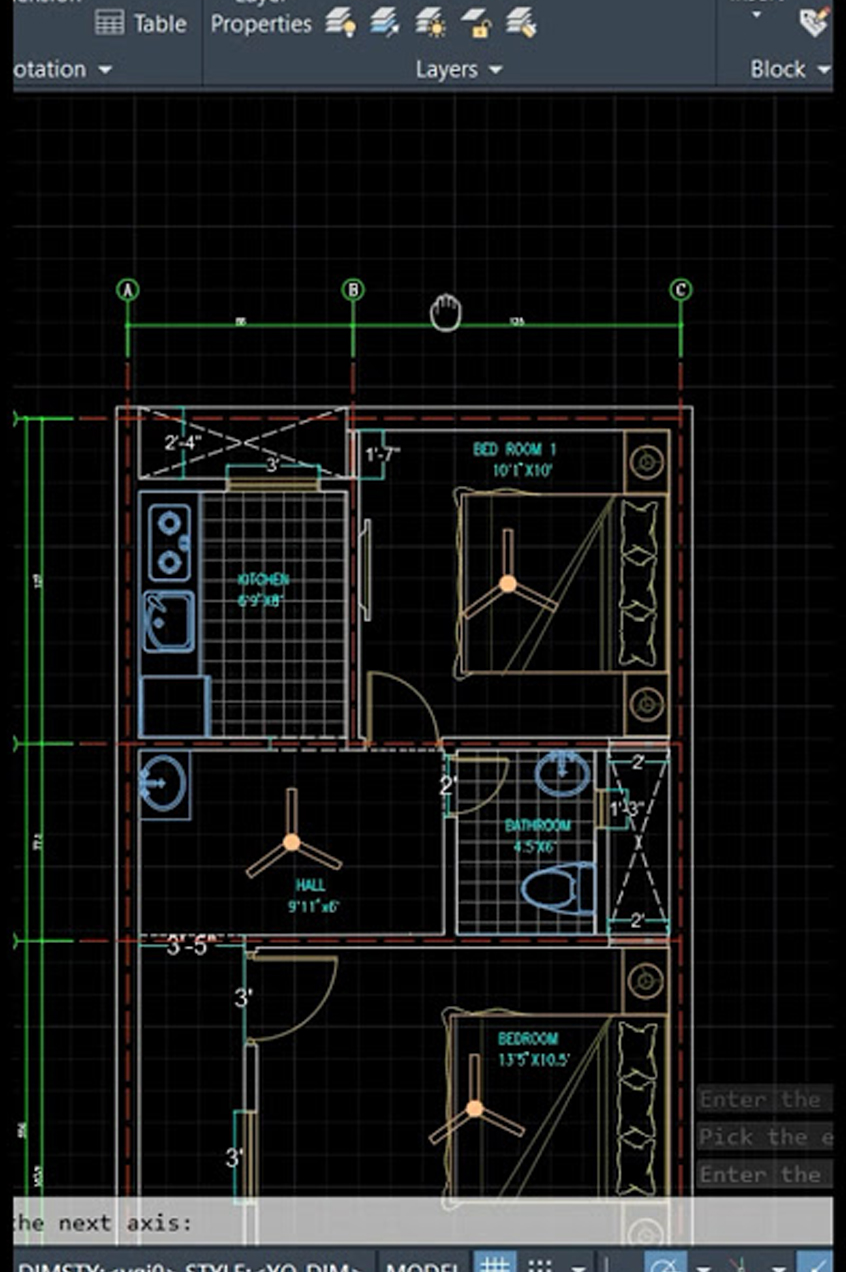
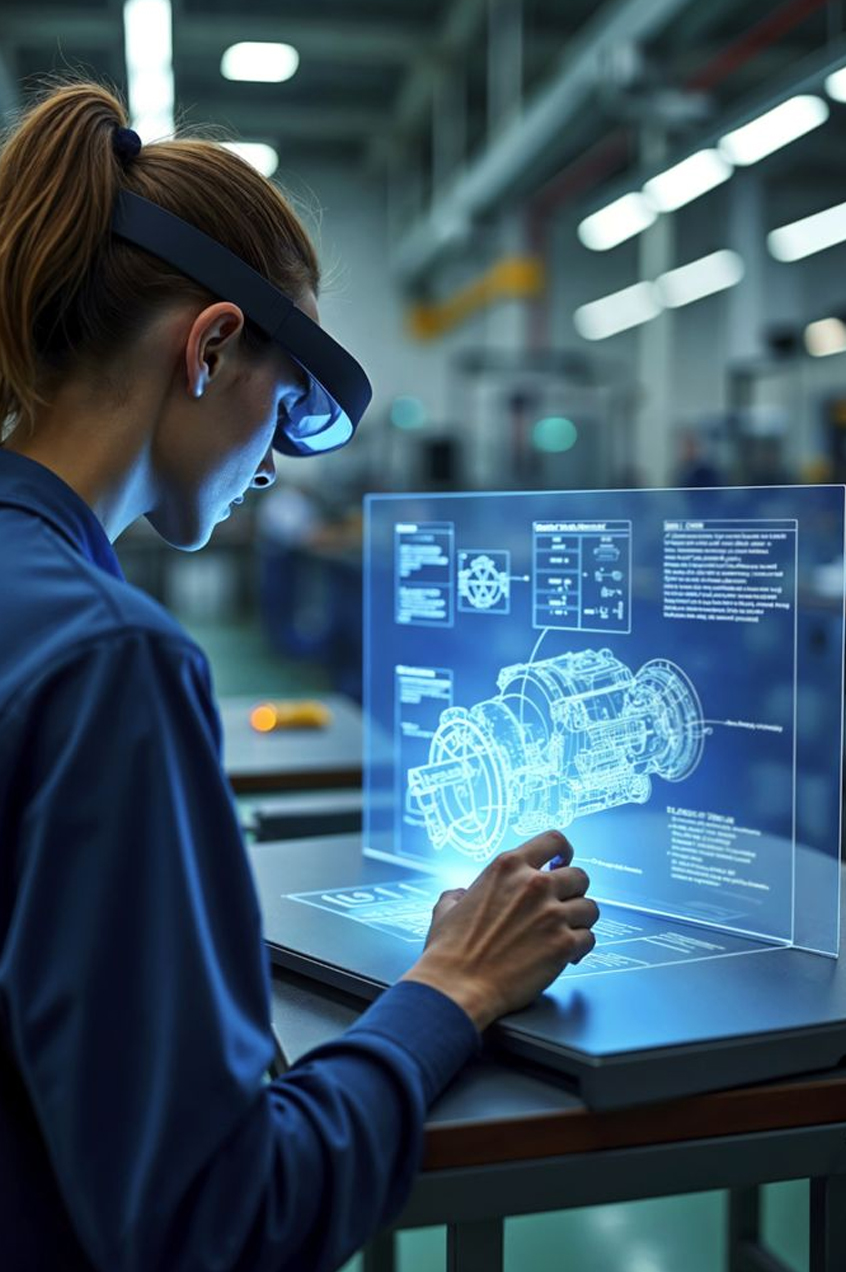
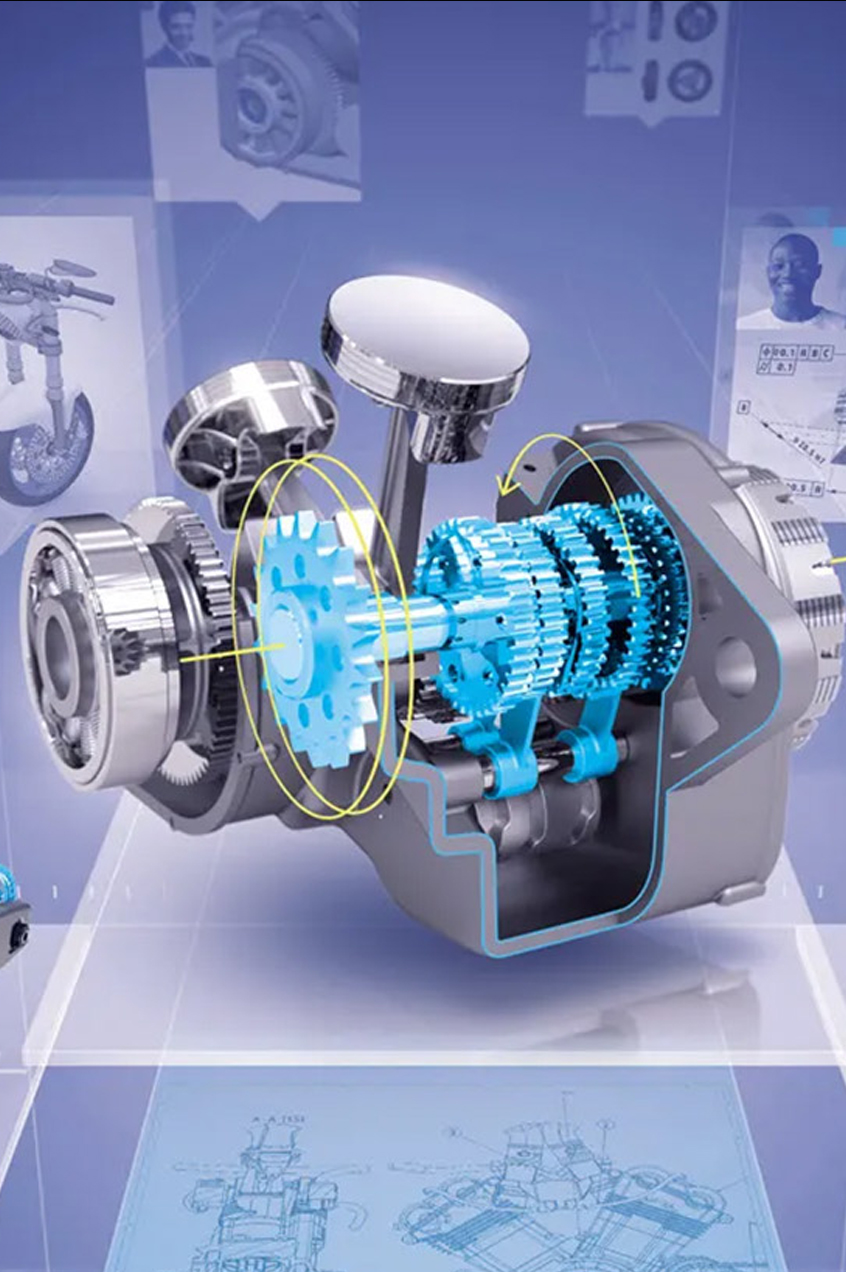
Design & manufacturing with CAD/CAM tools.
Learn CI/CD, Docker & Kubernetes basics.

Train predictive models & AI solutions.
Hands-on cloud platforms & architecture.
Build chatbots & AI-driven text tools.

Design modern interfaces with Figma & XD.

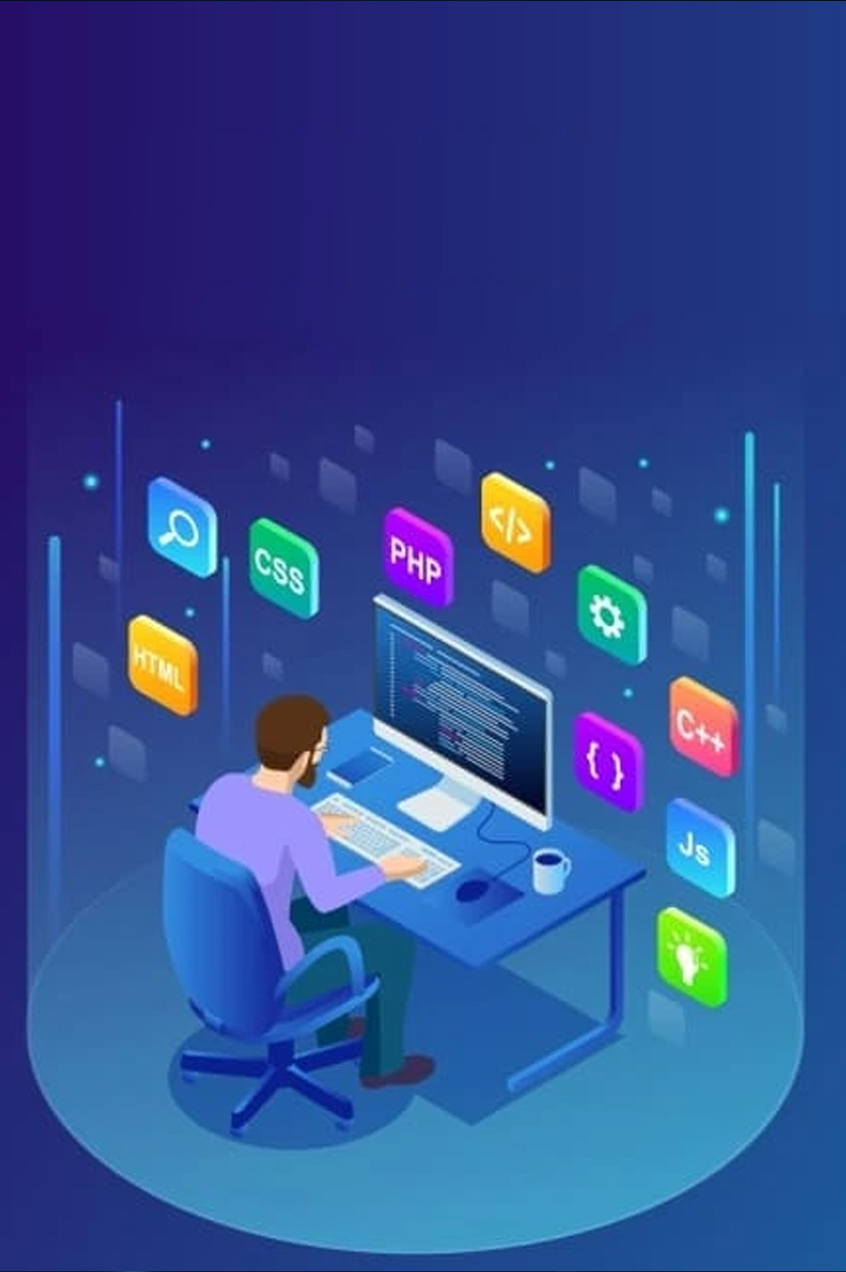
Learn HTML, CSS & responsive design.
Full-stack coding with MERN & PHP.

TechcaddMohali is a leading IT training and development institute offering advanced courses in AI, Web Development, Digital Marketing, and Data Science. We focus on real-world skills, hands-on projects, and career success.
Industry-ready training for students and professionals in top tech domains.
Learn by building real projects under expert mentors to boost your portfolio.
We ensure constant support, mentorship, and placement guidance.
Our team of experienced professionals is dedicated to delivering the best IT solutions, guiding you through every step of your digital journey.
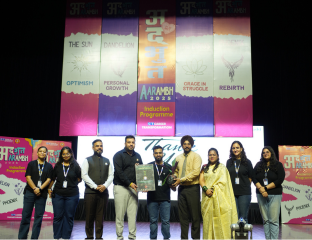
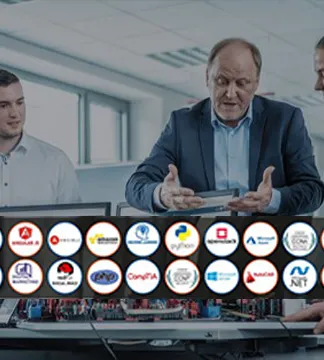
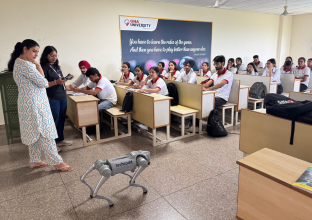
Amit from Techcadddelivered insights on how Artificial Intelligence shapes modern business and automation.
Students explored the latest tools in data science, cloud computing, and digital innovation through hands-on demos.
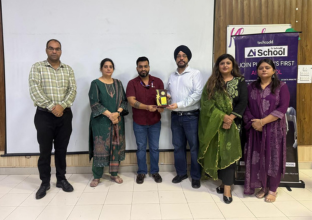
An engaging session on real-world digital marketing, SEO, and AI-based branding strategies for career growth.
A motivating seminar about entrepreneurship, innovation, and building scalable digital products.
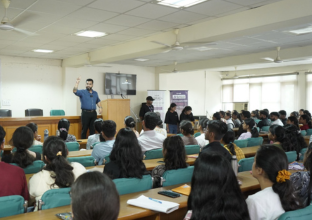
Focused on how AI, cloud, and cybersecurity are transforming today’s digital landscape.
Students learned essential security skills to stay safe online and protect digital identities.
Explored the intersection of artificial intelligence and entrepreneurship for future innovators.
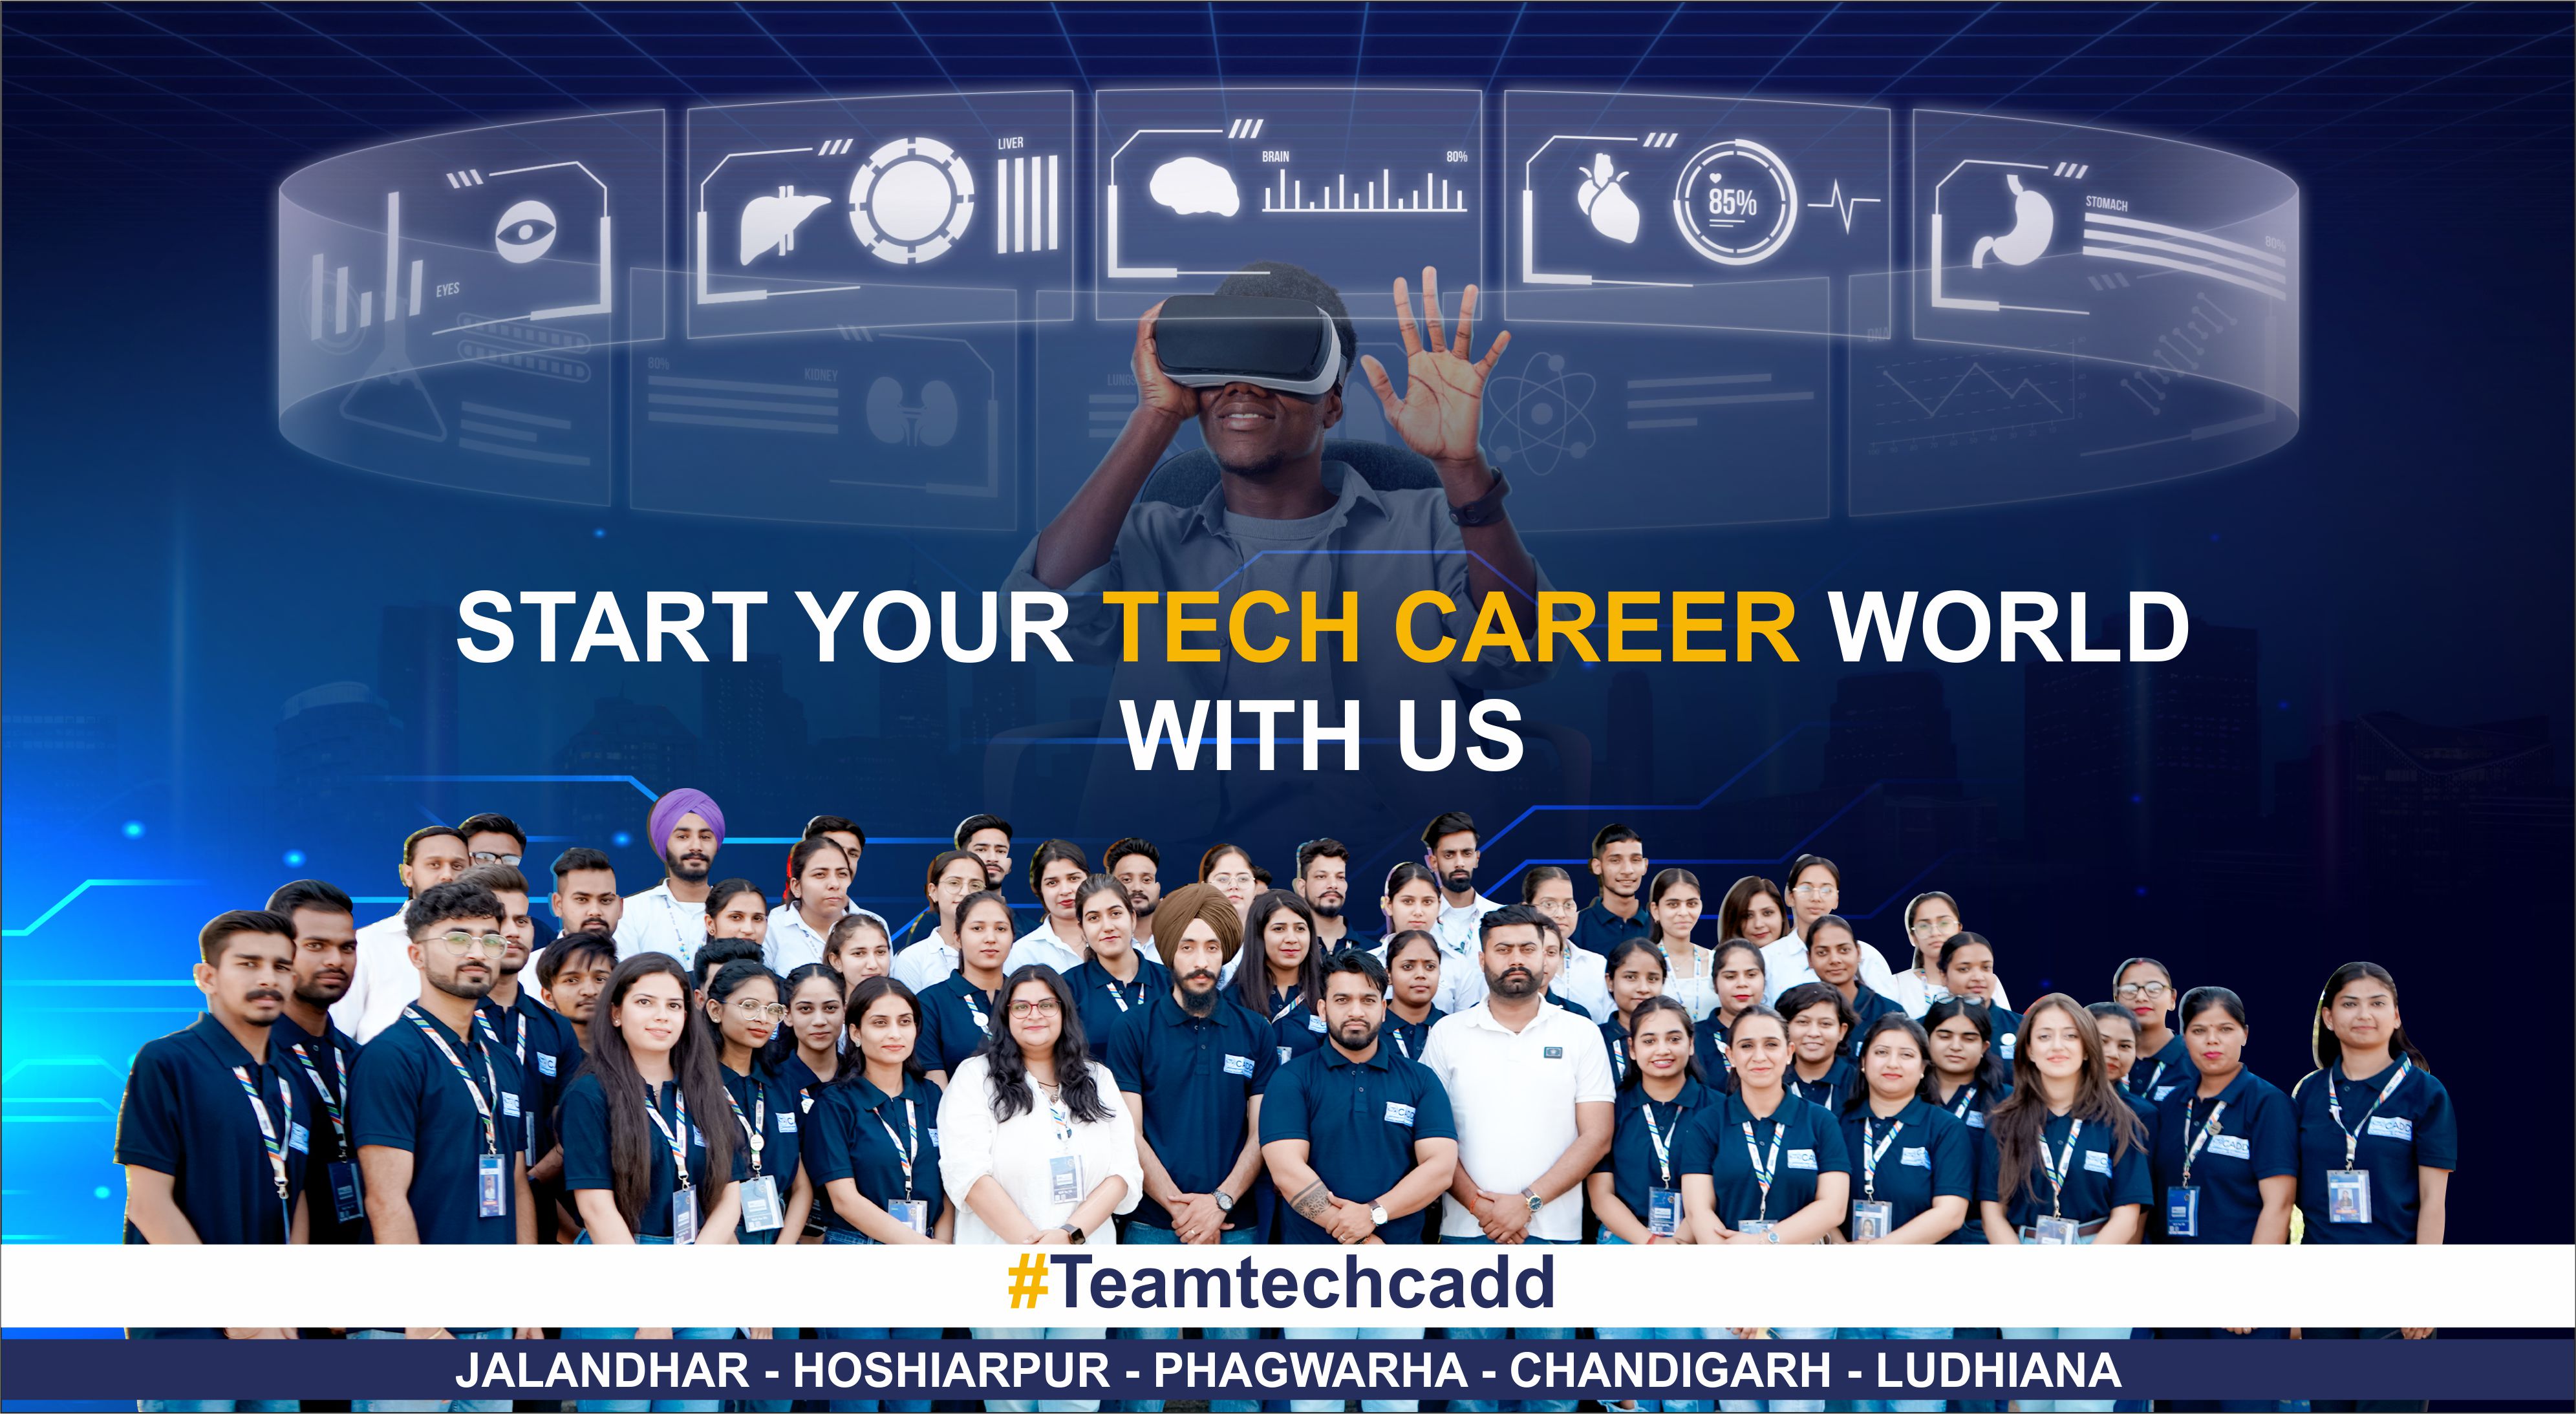
Join TechcaddMohali to master in-demand IT courses with real-world projects, expert guidance, and career-focused learning for your professional growth.


Discover success stories from our learners who have built strong tech careers through TechCadd’s industry-ready training.
“TechcaddMohali helped me gain strong command over Python programming through real-world projects and one-on-one guidance. The mentors ensured every concept was crystal clear and industry-ready.”
“The digital marketing course at TechcaddMohali was a game-changer for me. From SEO and Google Ads to real campaign analysis, everything was practical. I even got freelance projects before finishing the course.”
“Learning at TechcaddMohali was an amazing experience. The trainers explained every design principle in depth, and the live projects gave me confidence to start my career as a UI/UX designer.”
“The Data Science program at TechcaddMohali was perfectly structured. It included Python, statistics, machine learning, and visualization tools — all explained in a beginner-friendly way.”
“I joined TechcaddMohali for the MERN Stack course and got to work on multiple full-stack web apps. The trainers are industry experts who guide you like professionals, not just teachers.”
“The AI training at TechcaddMohali was beyond expectations. I learned neural networks, deep learning, and real-time AI tools that gave me an edge during interviews.”
“If you’re looking for the best Tally course in Mohali, Techcaddis the right place. Their practical accounting sessions and updated GST training helped me get placed in a finance firm.”
“The Cyber Security course at TechcaddMohali helped me understand ethical hacking, data protection, and system security. Their advanced lab setup gives a real experience of industry work.”
“I enrolled for Power BI at TechcaddMohali and learned to create professional dashboards and reports. The faculty focuses on practical analysis rather than just theory.”
“TechcaddMohali offers a creative and inspiring environment for graphic designing. The projects and portfolio sessions helped me build a strong base in Photoshop, Illustrator, and Canva.”
“The Web Development training at TechcaddMohali was completely hands-on. I learned HTML, CSS, JavaScript, and React through real client projects, which helped me land my first job quickly.”
“I joined TechcaddMohali to improve my Excel skills, and it turned out to be the best decision. The trainer covered everything from formulas to dashboards and data automation.”