


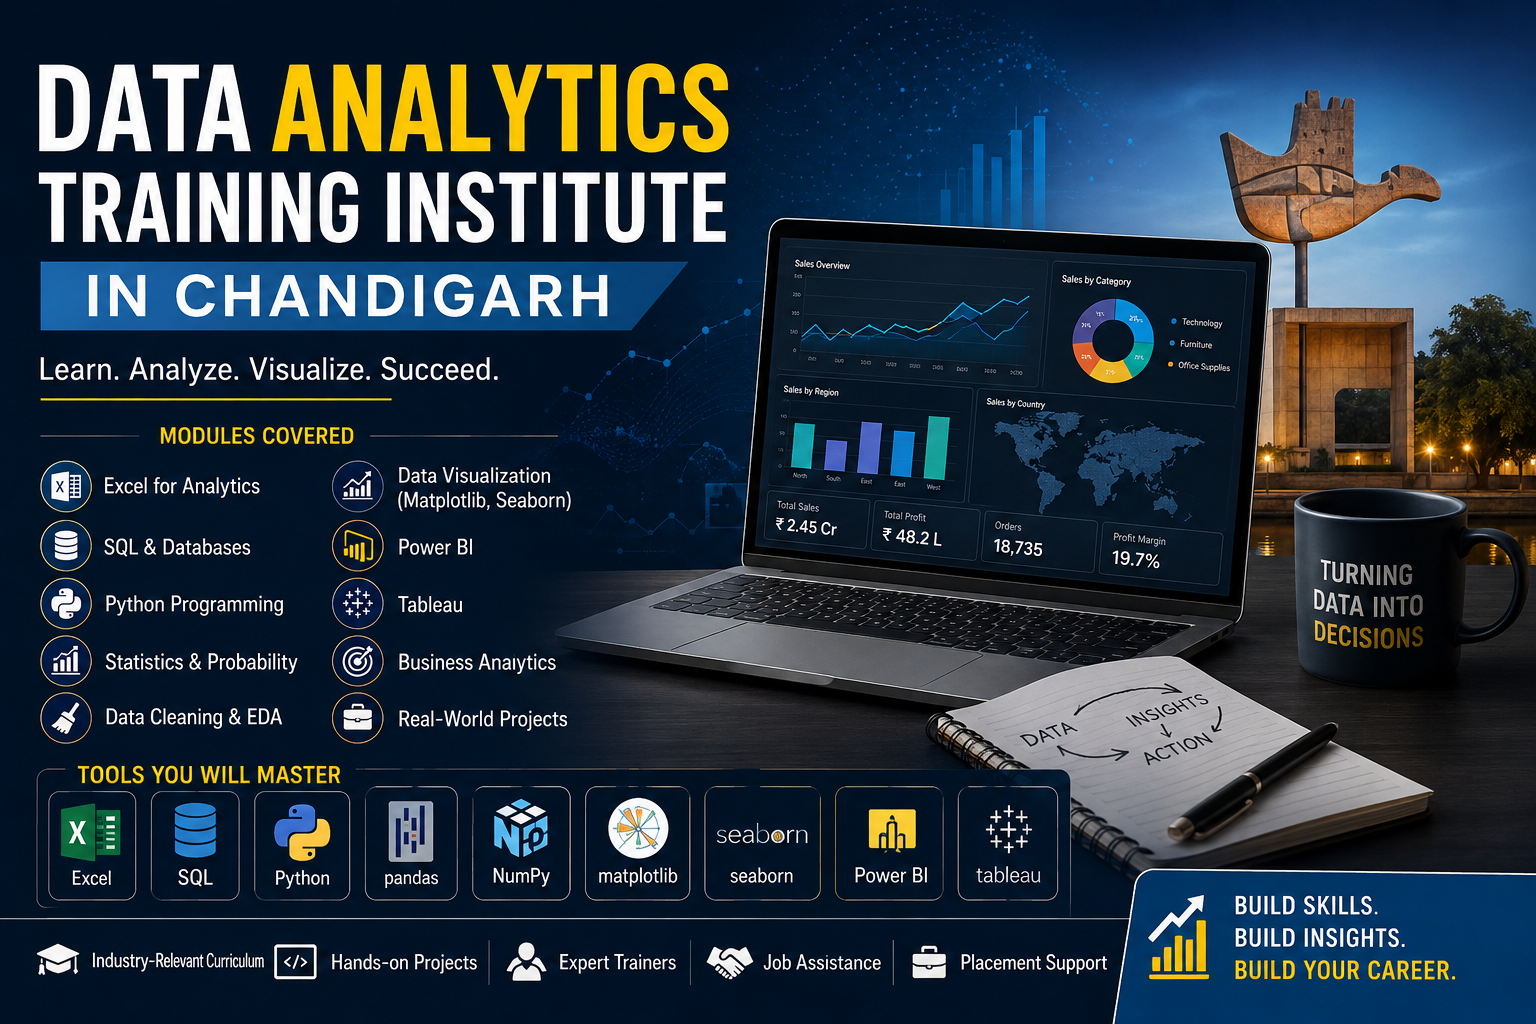
Data Analytics Training Institute in Chandigarh — Modules & Tools
In today's data-driven business environment, organizations generate enormous amounts of information through websites, applications, customer transactions, social media, sales systems, marketing campaigns, and business operations. However, collecting data is only the first step. The real value comes from understanding that data and converting it into useful insights that support better business decisions. This is where data analytics plays an important role.
A professional Data Analytics Training Institute in Chandigarh can help students, graduates, working professionals, and career changers develop the technical and analytical skills required to work with real-world data. A well-designed data analytics course combines concepts such as data cleaning, data analysis, statistics, databases, programming, visualization, reporting, and business intelligence.
The objective of data analytics training is not simply to teach software tools. Students should understand how to approach a business problem, identify the required data, clean and transform it, analyze patterns, create meaningful visualizations, and communicate insights to decision-makers. This practical approach helps learners develop job-oriented skills that can be applied across multiple industries.
What is Data Analytics?
Data analytics is the process of examining raw data to discover useful patterns, trends, relationships, and insights. Businesses use these insights to understand customers, improve operations, monitor performance, identify opportunities, reduce costs, and make informed decisions.
For example, an e-commerce company can analyze customer purchase data to determine which products are selling the most. A marketing team can analyze campaign data to identify which advertisements generate the highest number of leads. A company can use employee data to understand hiring trends and workforce performance.
Therefore, data analytics connects raw information with business decision-making.
Why Learn Data Analytics in Chandigarh?
Chandigarh and the surrounding Tricity region, including Mohali and Panchkula, have a growing technology, education, service, and business ecosystem. As organizations increasingly adopt digital systems, the requirement for professionals who can work with data is also increasing.
Learning data analytics can be useful for students from BCA, BBA, B.Com, B.Tech, MBA, and other academic backgrounds. It can also benefit working professionals who want to improve their reporting, business intelligence, or analytical capabilities.
A structured training program allows learners to progress from basic concepts to advanced analytical workflows without becoming overwhelmed by too many technologies at once.
Major Modules Covered in Data Analytics Training
A comprehensive data analytics curriculum should cover multiple stages of the data analytics lifecycle. These modules generally include Excel, SQL, Python, statistics, data visualization, Power BI, Tableau, exploratory data analysis, and practical projects.
1. Excel for Data Analytics
Microsoft Excel is one of the most widely used tools for business reporting and data analysis. It is often an ideal starting point for beginners because it provides a simple environment for understanding how data is organized and analyzed.
Students can learn:
-
Excel interface and workbook management
-
Data entry and formatting
-
Sorting and filtering
-
Conditional formatting
-
Basic and advanced formulas
-
IF, SUMIF, COUNTIF, AVERAGEIF
-
XLOOKUP and lookup functions
-
Text and date functions
-
Data validation
-
PivotTables
-
PivotCharts
-
Interactive dashboards
-
Data cleaning
-
Basic statistical analysis
Advanced Excel training can also introduce Power Query for importing, cleaning, and transforming data.
The objective is to help learners create accurate reports and perform day-to-day business analysis efficiently.
2. SQL for Data Analysis
SQL is an essential skill for data analysts because a large amount of business data is stored inside relational databases.
In SQL training, students learn how to retrieve and analyze data using queries.
Important topics include:
-
SELECT statements
-
WHERE conditions
-
ORDER BY
-
GROUP BY
-
HAVING
-
Aggregate functions
-
DISTINCT
-
CASE statements
-
Joins
-
Subqueries
-
Common Table Expressions
-
Window functions
-
Views
-
Data manipulation
-
Database concepts
Students can practice SQL using business datasets such as sales, customers, employees, products, and transactions.
For example, an analyst may need to determine total sales by region, identify the top-performing products, calculate monthly revenue, or find customers who have not purchased anything recently. SQL provides the foundation for answering these types of questions.
3. Python for Data Analytics
Python has become an important programming language for modern data analytics. It provides powerful libraries that allow analysts to clean, manipulate, explore, and visualize large datasets.
A data analytics course can introduce Python fundamentals before moving into data analysis.
Students can learn:
-
Variables and data types
-
Operators
-
Conditional statements
-
Loops
-
Functions
-
Lists, tuples, sets, and dictionaries
-
File handling
-
Exception handling
-
Basic object-oriented programming
-
Working with CSV and Excel files
After learning the fundamentals, students can move into data analytics libraries.
4. NumPy
NumPy is commonly used for numerical computing in Python. It introduces learners to arrays, mathematical operations, indexing, slicing, and numerical calculations.
Understanding NumPy can help students build a strong foundation for working with numerical datasets and other Python data science libraries.
5. Pandas
Pandas is one of the most important Python libraries for data analysis.
Students can learn how to:
-
Create DataFrames
-
Import datasets
-
Inspect data
-
Select rows and columns
-
Filter data
-
Handle missing values
-
Remove duplicates
-
Change data types
-
Rename columns
-
Group data
-
Merge datasets
-
Concatenate datasets
-
Apply functions
-
Perform aggregations
-
Export processed data
Pandas allows analysts to perform many data-cleaning and transformation tasks efficiently.
6. Statistics for Data Analytics
Statistics provides the mathematical foundation required to understand data properly.
A practical analytics course can cover:
-
Mean
-
Median
-
Mode
-
Range
-
Variance
-
Standard deviation
-
Percentiles
-
Probability
-
Distribution
-
Correlation
-
Regression basics
-
Sampling
-
Hypothesis testing
Statistics helps analysts avoid incorrect conclusions and understand whether patterns in a dataset are meaningful.
For example, an analyst comparing two marketing campaigns needs more than just the average sales value. Statistical concepts can help determine whether the observed difference is meaningful.
7. Exploratory Data Analysis
Exploratory Data Analysis, commonly called EDA, is an important stage of the analytics process.
EDA involves examining a dataset to understand its structure, quality, patterns, relationships, and unusual observations.
Students can learn how to:
-
Understand dataset dimensions
-
Identify data types
-
Detect missing values
-
Identify duplicates
-
Find outliers
-
Analyze distributions
-
Compare variables
-
Identify correlations
-
Generate summary statistics
-
Create exploratory visualizations
EDA helps analysts understand the story behind a dataset before creating final reports or dashboards.
8. Matplotlib and Seaborn
Data visualization helps convert numerical information into charts and graphs that are easier to understand.
Python libraries such as Matplotlib and Seaborn can be used to create visualizations.
Students can work with:
-
Bar charts
-
Line charts
-
Histograms
-
Scatter plots
-
Box plots
-
Pie charts
-
Heatmaps
-
Distribution plots
-
Count plots
Learners should also understand when to use a particular visualization. For example, a line chart can be useful for showing trends over time, while a scatter plot can help analyze relationships between two numerical variables.
9. Power BI
Power BI is a major business intelligence and data visualization platform used to create interactive reports and dashboards.
Power BI training can cover the complete reporting workflow, starting from data import and continuing through transformation, modeling, visualization, and dashboard development.
Important topics include:
-
Connecting data sources
-
Power Query
-
Data cleaning
-
Data transformation
-
Data modeling
-
Relationships
-
Calculated columns
-
Measures
-
DAX fundamentals
-
KPIs
-
Interactive charts
-
Filters
-
Slicers
-
Drill-down
-
Dashboard design
-
Report publishing
Students can build dashboards based on sales, finance, HR, marketing, customer, and operations datasets.
A good Power BI module should focus on business questions rather than simply teaching where different buttons are located.
10. Tableau
Tableau is another popular business intelligence and data visualization platform.
It allows analysts to transform data into interactive and visually appealing dashboards.
Students can learn:
-
Connecting datasets
-
Dimensions and measures
-
Filters
-
Sorting
-
Groups
-
Calculated fields
-
Parameters
-
Charts
-
Dashboards
-
Stories
-
Interactive visualizations
-
Dashboard formatting
-
Business reporting
Tableau is particularly useful for learners who want to develop strong data visualization and business intelligence skills.
11. Data Visualization Principles
Learning tools alone is not enough. Students should also understand how to communicate insights effectively.
A professional analytics program can teach principles such as:
-
Selecting the correct chart
-
Avoiding unnecessary visual elements
-
Using meaningful titles
-
Highlighting important information
-
Maintaining consistency
-
Creating logical dashboard layouts
-
Designing reports for specific audiences
-
Presenting insights clearly
The goal of visualization is to make information easier to understand, not simply to create attractive charts.
12. Business Analytics
Modern data analysts need to understand business problems as well as technical tools.
Business analytics training can introduce concepts such as:
-
Business KPIs
-
Sales analysis
-
Customer analysis
-
Marketing analytics
-
Financial analysis
-
HR analytics
-
Operations analytics
-
Performance reporting
-
Trend analysis
-
Root-cause analysis
For example, instead of simply showing that sales declined by 10%, an analyst should investigate why sales declined and identify the factors contributing to the change.
This business-oriented thinking makes analytics more valuable to organizations.
13. Real-World Projects
Projects are an important part of effective data analytics training. They allow students to apply multiple tools together and understand how an actual analytics workflow operates.
Possible projects include:
Sales Analytics Dashboard
Students can analyze sales transactions, revenue, profit, products, regions, and customers. The final project can include an interactive Power BI or Tableau dashboard.
Customer Analysis
Learners can analyze customer purchasing behavior, customer segments, average order value, retention patterns, and product preferences.
HR Analytics
An HR analytics project can examine employee demographics, salaries, departments, hiring trends, attrition, and workforce performance.
Marketing Analytics
Students can analyze campaign performance, leads, conversion rates, customer acquisition, and return on marketing investment.
E-Commerce Analytics
An e-commerce project can combine SQL, Python, Excel, and visualization tools to analyze orders, customers, products, revenue, and delivery performance.
These projects help learners build a portfolio that demonstrates practical skills.
Tools Used in Data Analytics Training
A professional data analytics program may include a combination of the following tools:
-
Microsoft Excel
-
SQL
-
MySQL
-
PostgreSQL
-
Python
-
NumPy
-
Pandas
-
Matplotlib
-
Seaborn
-
Power BI
-
Tableau
-
Power Query
-
DAX
-
Jupyter Notebook
-
Database management tools
The purpose of using multiple tools is not to make the course complicated. Each tool solves a different part of the analytics workflow.
For example, SQL can be used to retrieve information from databases, Python can be used for advanced data preparation and analysis, Excel can be useful for quick business calculations, and Power BI or Tableau can be used to communicate insights through dashboards.
Practical Learning Approach
A strong data analytics training program should follow a practical learning methodology.
Students should not only watch demonstrations. They should actively work with datasets, solve analytical problems, create reports, and explain their findings.
A typical learning cycle can be:
Understand the Problem → Collect Data → Clean Data → Analyze Data → Visualize Data → Generate Insights → Present Recommendations
This approach helps learners understand how data analysts work in professional environments.
Assignments, quizzes, SQL exercises, Python challenges, dashboard tasks, case studies, and projects can further strengthen analytical thinking.
Career Opportunities After Data Analytics Training
After completing a structured data analytics program, learners can explore various entry-level and intermediate career paths.
Possible roles include:
-
Data Analyst
-
Junior Data Analyst
-
Business Analyst
-
Business Intelligence Analyst
-
Reporting Analyst
-
MIS Analyst
-
Data Visualization Analyst
-
Marketing Analyst
-
Operations Analyst
-
Financial Data Analyst
Career opportunities can vary depending on the learner's educational background, technical skills, portfolio, communication ability, and practical experience.
Who Can Join a Data Analytics Course?
Data analytics training can be suitable for:
-
College students
-
Fresh graduates
-
Working professionals
-
Business professionals
-
IT professionals
-
Entrepreneurs
-
Career switchers
-
Beginners interested in data
-
Professionals looking to improve reporting skills
Students do not necessarily need to be advanced programmers to begin learning analytics. A structured curriculum can start with fundamentals and gradually introduce programming, databases, statistics, and business intelligence.
Building a Data Analytics Portfolio
A portfolio can be an important part of career preparation. Instead of simply mentioning that they have learned Excel, SQL, Python, Power BI, or Tableau, students can demonstrate their abilities through completed projects.
A good portfolio can include:
-
Excel dashboards
-
SQL case studies
-
Python EDA projects
-
Power BI dashboards
-
Tableau dashboards
-
Business analytics reports
-
Data-cleaning projects
-
Industry-specific case studies
Each project should explain the business problem, dataset, methodology, analysis, key findings, and recommendations.
Placement and Interview Preparation
Career-oriented data analytics training can also include interview preparation.
Students can practice:
-
Excel interview questions
-
SQL queries
-
Python data-analysis questions
-
Statistics questions
-
Power BI questions
-
Tableau questions
-
Business case studies
-
Dashboard-based questions
-
Analytical reasoning
-
Resume preparation
-
Portfolio presentation
-
Mock interviews
This helps learners become more confident when applying for analytics positions.
Why Choose a Practical Data Analytics Training Institute in Chandigarh?
Choosing the right institute is important because the quality of training can significantly influence a learner's understanding and practical capabilities.
Learners should look for a program that offers:
-
Structured curriculum
-
Experienced trainers
-
Hands-on exercises
-
Real-world datasets
-
Practical projects
-
Industry-oriented tools
-
Dashboard development
-
SQL practice
-
Python practice
-
Portfolio development
-
Interview preparation
The best learning experience combines technical knowledge with business thinking and practical problem-solving.
Conclusion
Data analytics is a powerful career skill because organizations across industries increasingly depend on data to make informed decisions. A comprehensive Data Analytics Training Institute in Chandigarh can provide learners with a structured path to develop these skills.
By learning Excel, SQL, Python, Pandas, NumPy, statistics, data visualization, Power BI, Tableau, and business analytics, students can understand the complete journey from raw data to meaningful business insights.
More importantly, practical projects and real-world case studies help learners move beyond theoretical knowledge. They learn how to clean messy datasets, analyze business problems, build dashboards, identify trends, communicate insights, and present recommendations.
For students and professionals looking to enter or grow within the analytics field, developing a combination of technical, analytical, visualization, and communication skills can provide a strong foundation for long-term career growth. With consistent practice and project-based learning, learners can build a professional portfolio and prepare themselves for opportunities in the rapidly growing data analytics ecosystem.


Comments (0)
No comments yet. Be the first to share your thoughts!