
Introduction: Understanding Data Science and Data Analytics Curricula
If you're considering a career in the data field, one of the first questions you'll ask is: "What will I actually learn in a data science course?" or "What does a data analytics syllabus cover?" Understanding the curriculum is essential for making an informed decision about your education and career path.
The terms data science and data analytics are often used interchangeably, but their syllabi reflect different focuses, depths, and career outcomes. A data science course syllabus typically covers more advanced topics like machine learning, deep learning, and predictive modeling. A data analytics syllabus focuses on extracting insights from existing data using tools like Excel, SQL, and visualization platforms.
This comprehensive guide breaks down exactly what you learn in data science and data analytics courses, comparing the curricula, topics, tools, and projects you can expect. Whether you're a student planning your education or a professional considering a career switch, this guide will help you understand what each path entails.
-
Curriculum clarity: Understand exactly what you'll study
-
Path comparison: Data science vs data analytics syllabi
-
Career alignment: Choose based on your goals
-
Practical insights: Real topics, tools, and projects
-
Informed decision: Know before you enroll
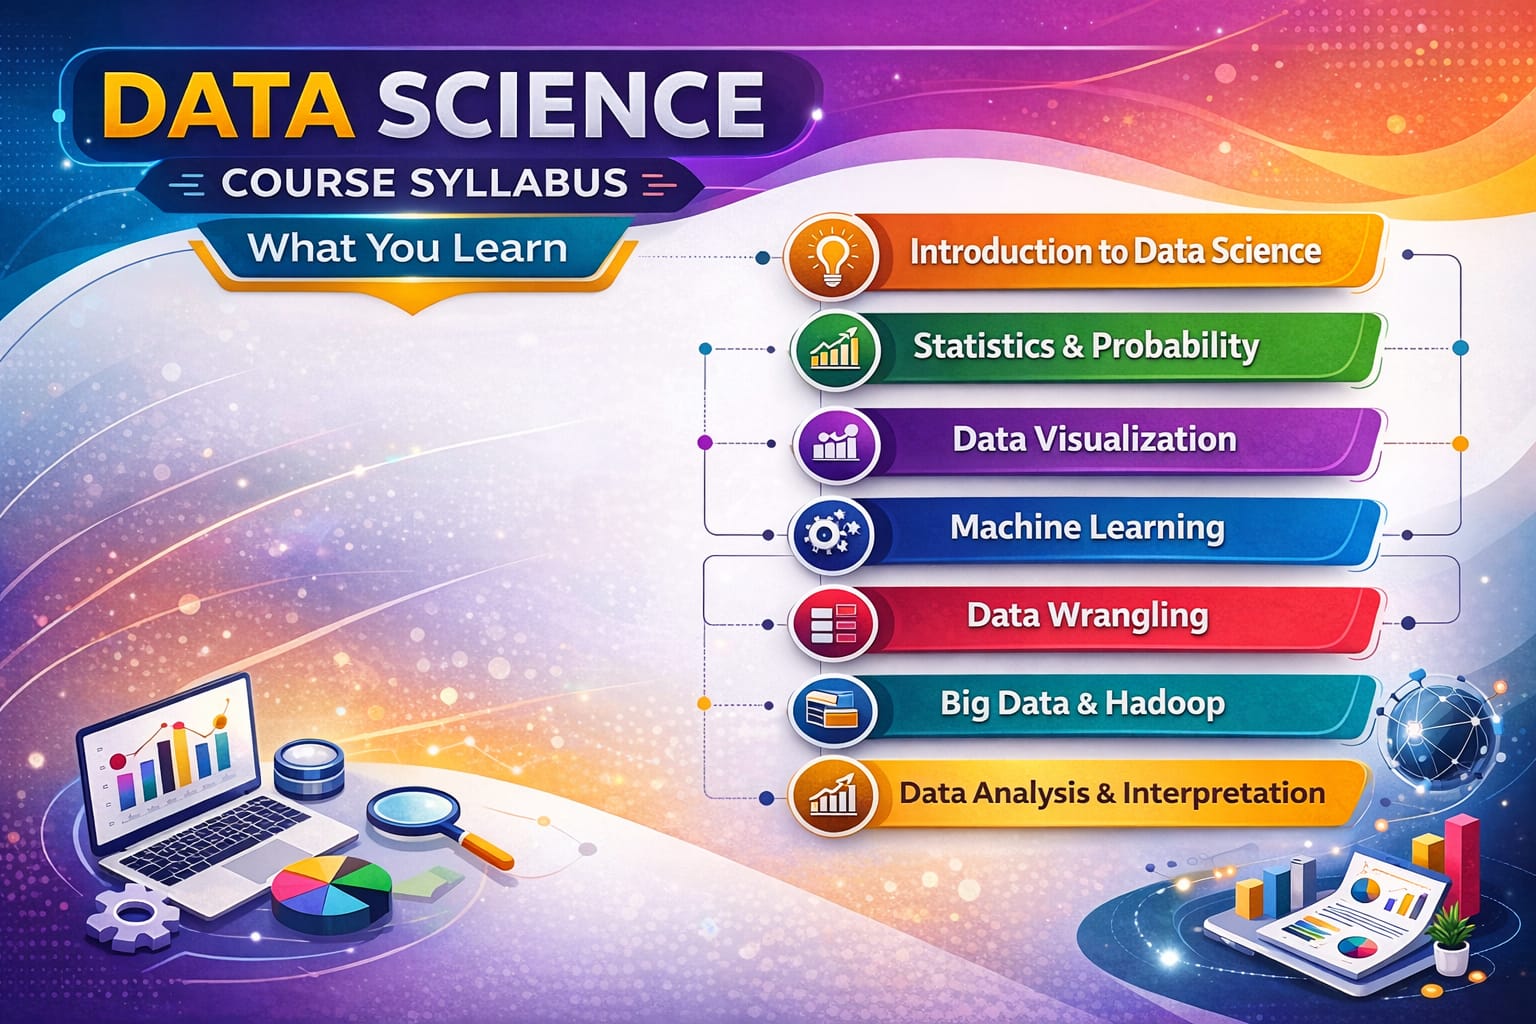
Section 1: Data Analytics Course Syllabus – Complete Breakdown
1.1 Overview of Data Analytics Curriculum
A data analytics course is designed to teach you how to collect, clean, analyze, and visualize data to support business decision-making. The focus is on working with existing data to uncover insights, identify trends, and communicate findings to stakeholders.
The typical data analytics syllabus spans 3-6 months and covers the following core areas:
-
Data fundamentals: Understanding data types, sources, and structures
-
Data manipulation: Cleaning, transforming, and preparing data for analysis
-
Data analysis: Applying statistical techniques to derive insights
-
Data visualization: Creating charts, graphs, and dashboards
-
Business communication: Presenting findings to non-technical audiences
-
Duration: Typically 3-6 months
-
Focus: Working with existing data for insights
-
Output: Reports, dashboards, business recommendations
-
Target roles: Data analyst, business analyst, BI analyst
1.2 Module 1: Excel for Data Analysis
Excel is the foundation of data analytics and remains one of the most widely used tools in business. The Excel module typically covers:
Excel Basics: Navigation, data entry, formatting, cell referencing, basic formulas (SUM, AVERAGE, COUNT). You'll learn to organize data effectively and perform basic calculations.
Advanced Formulas: Logical functions (IF, AND, OR, nested IF), lookup functions (VLOOKUP, HLOOKUP, INDEX, MATCH), text functions, date functions, and statistical functions. These are essential for real-world data work.
Pivot Tables: Creating pivot tables, formatting reports, adding calculated fields, and creating pivot charts. Pivot tables are perhaps the most powerful feature in Excel for quick analysis.
Data Visualization: Creating various chart types, formatting, and combining charts into dashboards. You'll learn to communicate insights visually.
What-If Analysis: Scenario manager, goal seek, data tables for sensitivity analysis and forecasting.
-
Hours: 30-40 hours of training
-
Projects: Sales dashboard, financial model, HR analytics dashboard
-
Outcome: Professional Excel skills for business analysis
1.3 Module 2: SQL for Data Extraction
SQL is the language of data – essential for extracting information from databases. The SQL module typically covers:
Database Fundamentals: Understanding relational databases, tables, rows, columns, primary keys, foreign keys. You'll learn how data is organized in real-world systems.
Basic Queries: SELECT statements, filtering with WHERE, sorting with ORDER BY, limiting results. You'll retrieve specific data based on conditions.
Aggregation and Grouping: Aggregate functions (COUNT, SUM, AVG, MIN, MAX), GROUP BY for summaries, HAVING for filtering groups. You'll answer business questions like "total sales by region."
Joins and Relationships: INNER JOIN, LEFT JOIN, RIGHT JOIN, FULL OUTER JOIN for combining data from multiple tables. Essential for working with real databases.
Subqueries and CTEs: Nested queries and common table expressions for complex data retrieval.
Window Functions: ROW_NUMBER, RANK, LAG, LEAD for advanced analytics like running totals and comparisons.
-
Hours: 40-50 hours of training
-
Projects: Customer database analysis, sales performance analysis
-
Outcome: Ability to extract and analyze data from databases
1.4 Module 3: Python for Data Analysis
Python has become the most popular language for data analysis. The Python module typically covers:
Python Basics: Variables, data types, operators, control flow (if-else, loops), functions, data structures (lists, tuples, dictionaries, sets). You'll learn to write your first programs.
NumPy for Numerical Computing: Creating arrays, array operations, broadcasting, mathematical functions. NumPy is the foundation for numerical work.
Pandas for Data Manipulation: Series and DataFrames, reading/writing data (CSV, Excel, JSON), data cleaning (handling missing values, duplicates), data transformation (filtering, grouping, merging, pivoting). Pandas is the most important library for data work.
Data Visualization with Matplotlib and Seaborn: Creating line plots, scatter plots, bar charts, histograms, heatmaps, pair plots. You'll learn to create publication-quality charts.
-
Hours: 50-60 hours of training
-
Projects: Data cleaning projects, exploratory data analysis
-
Outcome: Ability to manipulate and analyze data programmatically
1.5 Module 4: Statistics for Data Analysis
Statistics provides the mathematical foundation for data analysis. This module typically covers:
Descriptive Statistics: Measures of central tendency (mean, median, mode), measures of dispersion (range, variance, standard deviation), percentiles, quartiles, data distributions.
Probability Basics: Basic probability concepts, conditional probability, probability distributions, random variables, expected value.
Inferential Statistics: Sampling, sampling distributions, Central Limit Theorem, hypothesis testing, confidence intervals, p-values, A/B testing fundamentals.
-
Hours: 20-30 hours of training
-
Projects: A/B testing analysis, statistical quality control
-
Outcome: Solid foundation for accurate analysis
1.6 Module 5: Data Visualization with Power BI and Tableau
Data visualization is how you communicate insights. This module typically covers:
Power BI Fundamentals: Connecting to data sources, data modeling, creating visualizations, building interactive dashboards, publishing and sharing.
Advanced Power BI: DAX formulas, calculated columns, measures, time intelligence functions, row-level security.
Tableau: Connecting to data, creating worksheets and dashboards, advanced visualizations, storytelling with data.
Dashboard Design Principles: Choosing the right charts, creating narratives, designing for your audience.
-
Hours: 40-50 hours of training
-
Projects: Interactive dashboards for business problems
-
Outcome: Professional dashboard creation skills
1.7 Module 6: Capstone Projects
The final module integrates everything learned into comprehensive projects. Students typically complete 2-3 end-to-end projects using real datasets, demonstrating their ability to solve business problems independently.
-
Projects: Sales analysis, customer segmentation, financial reporting
-
Outcome: Portfolio-ready work for job applications
Section 2: Data Science Course Syllabus – Complete Breakdown
2.1 Overview of Data Science Curriculum
A data science course is more advanced and comprehensive than data analytics. It covers the entire data lifecycle – from collection and cleaning to modeling, deployment, and maintenance of predictive systems. The focus is on building algorithms that can learn from data and make predictions.
The typical data science syllabus spans 6-12 months and covers everything in data analytics plus advanced topics:
-
Advanced programming: Python deep dive, object-oriented programming
-
Machine learning: Supervised and unsupervised algorithms
-
Deep learning: Neural networks, CNNs, RNNs
-
Big data technologies: Spark, Hadoop
-
MLOps: Model deployment and monitoring
-
Duration: Typically 6-12 months
-
Focus: Building predictive models and intelligent systems
-
Output: Models, algorithms, prediction APIs
-
Target roles: Data scientist, ML engineer, AI specialist
2.2 Module 1: Advanced Python Programming
Data science requires deeper Python knowledge than analytics. This module covers:
Advanced Python: Object-oriented programming, classes, inheritance, error handling, decorators, generators, context managers.
NumPy Advanced: Advanced array operations, broadcasting, linear algebra, random number generation for simulations.
Pandas Advanced: Multi-indexing, advanced grouping, time series analysis, performance optimization, working with large datasets.
Data Structures and Algorithms: Basic algorithms, complexity analysis, optimization for data-intensive applications.
-
Hours: 60-80 hours
-
Foundation: Essential for machine learning
2.3 Module 2: Mathematics and Statistics for Data Science
Data science requires deeper mathematical foundations. This module covers:
Linear Algebra: Vectors, matrices, matrix operations, eigenvalues, eigenvectors, singular value decomposition – the language of machine learning.
Calculus: Derivatives, gradients, partial derivatives, chain rule – foundation for optimization algorithms like gradient descent.
Probability: Probability distributions, Bayes' theorem, random variables, expectation, variance, covariance, correlation.
Statistical Inference: Maximum likelihood estimation, Bayesian inference, hypothesis testing, confidence intervals.
-
Hours: 60-80 hours
-
Importance: Theoretical foundation for understanding algorithms
2.4 Module 3: Machine Learning
Machine learning is the heart of data science. This module typically covers:
Machine Learning Fundamentals: Types of learning (supervised, unsupervised, reinforcement), the machine learning workflow, bias-variance tradeoff, overfitting and underfitting.
Regression Algorithms: Linear regression, polynomial regression, regularization (Ridge, Lasso, ElasticNet), evaluation metrics (MSE, RMSE, MAE, R-squared).
Classification Algorithms: Logistic regression, K-nearest neighbors, decision trees, random forests, support vector machines, evaluation metrics (accuracy, precision, recall, F1-score, ROC curves).
Clustering Algorithms: K-means, hierarchical clustering, DBSCAN, evaluation metrics (silhouette score, inertia).
Dimensionality Reduction: Principal Component Analysis (PCA), t-SNE, feature selection techniques.
Ensemble Methods: Bagging, boosting, stacking, gradient boosting (XGBoost, LightGBM, CatBoost).
Model Evaluation and Selection: Cross-validation, hyperparameter tuning, grid search, random search.
-
Hours: 100-120 hours
-
Projects: Prediction models, classification systems, customer segmentation
-
Outcome: Ability to build and evaluate ML models
2.5 Module 4: Deep Learning
Deep learning enables solving complex problems like image recognition and natural language processing. This module covers:
Neural Networks Fundamentals: Perceptrons, activation functions, forward propagation, backpropagation, gradient descent optimization, loss functions.
Deep Neural Networks: Multi-layer networks, vanishing gradients, regularization for deep networks, dropout, batch normalization.
Convolutional Neural Networks (CNNs) : Convolutional layers, pooling layers, CNN architectures (LeNet, AlexNet, VGG, ResNet), transfer learning, image classification, object detection.
Recurrent Neural Networks (RNNs) : Sequence modeling, LSTMs, GRUs, vanishing gradient in RNNs, applications in time series and NLP.
Advanced Architectures: Autoencoders, generative adversarial networks (GANs), transformers, attention mechanisms.
Deep Learning Frameworks: TensorFlow, Keras, PyTorch fundamentals.
-
Hours: 80-100 hours
-
Projects: Image classification, sentiment analysis, text generation
-
Outcome: Ability to build deep learning models
2.6 Module 5: Big Data Technologies
When data doesn't fit on a single machine, big data technologies become essential. This module covers:
Big Data Fundamentals: Distributed computing concepts, MapReduce paradigm, Hadoop ecosystem.
Apache Spark: RDDs, DataFrames, Spark SQL, MLlib for distributed machine learning, streaming for real-time data.
Working with Large Datasets: Partitioning, caching, optimization techniques for big data processing.
Cloud Platforms: AWS (S3, EMR, SageMaker), Azure (HDInsight, Machine Learning), GCP (BigQuery, Dataflow).
-
Hours: 40-60 hours
-
Importance: Essential for large-scale data science
2.7 Module 6: MLOps and Model Deployment
Building models is only half the work – deploying and maintaining them is equally important. This module covers:
Model Deployment: REST APIs for models, Flask/FastAPI for serving models, containerization with Docker.
Model Monitoring: Detecting data drift, concept drift, performance degradation, automated retraining.
MLOps Tools: MLflow for experiment tracking, Kubeflow for orchestration, CI/CD for machine learning.
Cloud Deployment: Deploying models on AWS SageMaker, Azure ML, GCP AI Platform.
-
Hours: 30-40 hours
-
Outcome: Ability to put models into production
2.8 Module 8: Capstone Projects
Data science programs culminate in comprehensive projects that demonstrate mastery of the entire pipeline. Students typically complete 2-3 major projects:
Predictive Modeling Project: End-to-end solution for a business problem – from data collection to model deployment.
Deep Learning Project: Computer vision, NLP, or generative AI application.
Big Data Project: Processing and analyzing large-scale datasets using Spark.
-
Projects: Real-world problems, portfolio-ready work
-
Outcome: Demonstrated capability to employers
Section 3: What You Learn in Data Science – Key Takeaways
3.1 Technical Skills You'll Gain
By completing a data science course, you'll gain proficiency in:
-
Programming: Python (advanced), SQL, R (optional)
-
Data Manipulation: Pandas, NumPy, data cleaning, feature engineering
-
Machine Learning: Scikit-learn, algorithms, model evaluation
-
Deep Learning: TensorFlow, Keras, neural networks
-
Big Data: Spark, Hadoop, cloud platforms
-
Visualization: Matplotlib, Seaborn, Power BI, Tableau
-
MLOps: Model deployment, monitoring, maintenance
3.2 Analytical Skills You'll Develop
-
Problem formulation: Translating business problems into data science tasks
-
Experimental design: Setting up rigorous experiments and A/B tests
-
Critical thinking: Questioning assumptions, validating results
-
Communication: Explaining complex models to non-technical audiences
-
Research orientation: Staying current with latest algorithms and techniques
3.3 Projects You'll Build
-
Predictive models for business forecasting
-
Classification systems for customer churn, fraud detection
-
Recommendation engines for e-commerce
-
Computer vision systems for image classification
-
NLP applications for sentiment analysis, chatbots
-
Big data pipelines for large-scale analytics

Comments
No comments yet. Be the first to comment.
Leave a Comment