
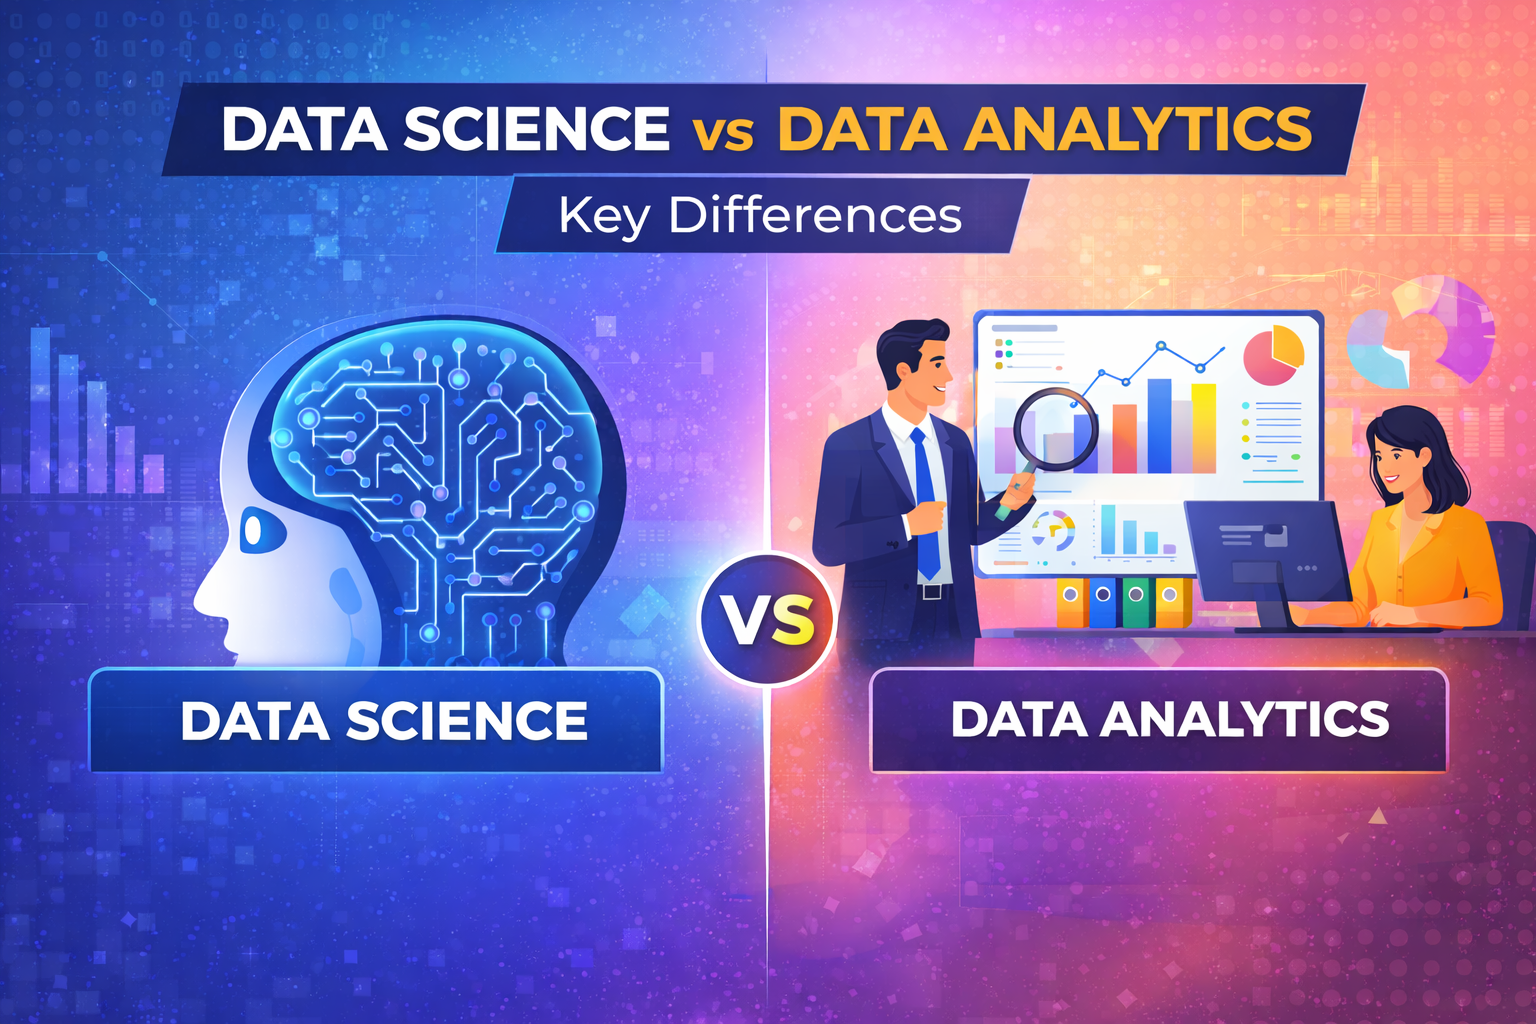
Introduction: Understanding the Data Field
The world of data has exploded in recent years, creating numerous career opportunities. However, for those entering this field, the terminology can be confusing. Two terms that often create confusion are data science and data analytics, along with the corresponding roles of data scientist and data analyst. While these terms are sometimes used interchangeably, they represent distinct disciplines with different focuses, skill requirements, and career trajectories.
If you're considering a career in the data field, understanding the difference between data science vs data analytics is crucial for making the right choice. Your decision will impact the skills you need to learn, the type of work you'll do daily, your earning potential, and your long-term career path.
This comprehensive guide will clarify the distinctions between these fields, compare data analyst vs data scientist roles, and help you decide which path aligns better with your interests, background, and career goals.
-
Growing confusion: Terms used interchangeably despite distinct meanings
-
Career implications: Different skills, work, salary, and paths
-
Decision guide: Helps you choose the right direction
-
Comprehensive comparison: Roles, responsibilities, skills, salary
-
Expert insights: Based on industry reality, not textbook definitions

Section 1: What is Data Analytics?
1.1 Definition and Core Purpose
Data analytics is the process of examining raw data to draw conclusions, identify patterns, and support decision-making. It focuses on analyzing historical data to understand what happened, why it happened, and what might happen in the future based on past trends.
The core purpose of data analytics is to derive actionable insights from existing data. Data analysts work with structured data, typically stored in databases or spreadsheets, and use statistical techniques and visualization tools to uncover trends and answer specific business questions.
Data analytics is fundamentally about description and diagnosis. It answers questions like:
-
What happened last quarter?
-
Why did sales decline in this region?
-
Which customer segment is most profitable?
-
How did our marketing campaign perform?
-
What are the current trends in our business?
-
Focus: Analyzing historical data for insights
-
Purpose: Understand what happened and why
-
Data type: Primarily structured data
-
Questions answered: Descriptive and diagnostic
-
Output: Reports, dashboards, visualizations
-
Time horizon: Past and present focused
1.2 Key Responsibilities of a Data Analyst
Data analysts have a clearly defined set of responsibilities that center around working with existing data to support business decisions.
Data Collection and Cleaning: Analysts gather data from various sources – databases, spreadsheets, APIs – and clean it to ensure accuracy. This involves handling missing values, removing duplicates, and correcting inconsistencies. Data cleaning often consumes 70-80% of an analyst's time.
Exploratory Data Analysis: Analysts explore datasets to understand their structure, identify patterns, and generate hypotheses. They calculate summary statistics, create visualizations, and look for relationships between variables.
Reporting and Dashboarding: A core responsibility is creating reports and dashboards that communicate insights to stakeholders. Using tools like Power BI and Tableau, analysts build visual representations of data that make complex information accessible.
Business Communication: Analysts must translate technical findings into language that business leaders can understand. They present insights, answer questions, and recommend actions based on data.
Ad-hoc Analysis: When business questions arise, analysts perform quick analyses to provide answers. This requires flexibility and the ability to work under time pressure.
-
Data cleaning: 70-80% of time, ensuring data quality
-
Exploratory analysis: Understanding data, finding patterns
-
Reporting: Creating regular reports for stakeholders
-
Dashboarding: Building visual tools with Power BI, Tableau
-
Communication: Translating technical findings for business
-
Ad-hoc analysis: Answering specific business questions
1.3 Tools Used by Data Analysts
Data analysts work with a focused set of tools designed for data manipulation, analysis, and visualization.
SQL is the most essential tool. Analysts use SQL to query databases, extract data, and perform basic analysis. Proficiency in SQL is tested in almost every data analyst interview.
Excel remains ubiquitous in business settings. Analysts use Excel for quick analysis, financial modeling, and creating reports that business users understand.
Python or R are used for more advanced analysis. Python, with libraries like Pandas and NumPy, is increasingly popular for data manipulation beyond Excel's capabilities.
Power BI and Tableau are the leading visualization tools. Analysts use them to create interactive dashboards that make data accessible to non-technical stakeholders.
Statistics provides the mathematical foundation. Understanding concepts like mean, median, standard deviation, correlation, and hypothesis testing is essential.
-
SQL: Database querying, data extraction – essential skill
-
Excel: Quick analysis, financial modeling, business reporting
-
Python/R: Advanced manipulation, analysis automation
-
Power BI/Tableau: Visualization, dashboards, storytelling
-
Statistics: Foundation for accurate analysis
-
Focused toolkit: Designed for efficiency, not complexity
Section 2: What is Data Science?
2.1 Definition and Core Purpose
Data science is a broader, more advanced field that encompasses the entire lifecycle of data – from collection and cleaning to analysis, modeling, and deployment of predictive systems. While data analytics focuses on historical data, data science is concerned with predicting future outcomes and building intelligent systems that can learn from data.
The core purpose of data science is to predict and prescribe. Data scientists build models that forecast future trends, classify data into categories, and recommend optimal actions. They work with both structured and unstructured data, including text, images, and video.
Data science answers questions like:
-
What will sales be next quarter?
-
Which customers are likely to churn?
-
Is this transaction fraudulent?
-
What product should we recommend to this user?
-
How can we optimize this process automatically?
-
What patterns exist in this unstructured data?
-
Focus: Predicting future outcomes, building intelligent systems
-
Purpose: Forecast, classify, recommend, optimize
-
Data type: Structured and unstructured (text, images, video)
-
Questions answered: Predictive and prescriptive
-
Output: Models, algorithms, prediction systems
-
Time horizon: Future focused
2.2 Key Responsibilities of a Data Scientist
Data scientists have a broader and more complex set of responsibilities that span the entire machine learning lifecycle.
Problem Definition: Data scientists work with stakeholders to define business problems that can be solved with data. This requires understanding both business context and technical possibilities.
Data Collection and Preparation: Like analysts, data scientists spend significant time gathering and cleaning data. However, they often work with more complex, unstructured data sources.
Feature Engineering: Data scientists create features from raw data that will help machine learning models perform better. This requires creativity and deep domain knowledge.
Model Building: Data scientists select appropriate algorithms, train models, and tune hyperparameters to optimize performance. This involves regression, classification, clustering, and more advanced techniques.
Model Evaluation: Rigorously testing models to ensure they perform well on unseen data. This involves cross-validation, A/B testing, and various metrics depending on the problem.
Deployment: In many organizations, data scientists are responsible for deploying models to production, making their work accessible to users and systems.
Monitoring and Maintenance: Once deployed, models must be monitored for performance degradation and retrained as needed.
-
Problem definition: Translate business needs into data problems
-
Data preparation: Complex, unstructured data sources
-
Feature engineering: Create inputs for machine learning
-
Model building: Select algorithms, train, tune
-
Model evaluation: Test rigorously, ensure performance
-
Deployment: Put models into production
-
Monitoring: Track performance, retrain as needed
2.3 Tools Used by Data Scientists
Data scientists work with a more extensive and complex toolkit than data analysts.
Python is the primary language, with libraries for every aspect of the data science workflow – Pandas for data manipulation, Scikit-learn for machine learning, TensorFlow and PyTorch for deep learning.
SQL remains essential for data extraction, though data scientists often write more complex queries than analysts.
R is popular in academic and research settings, particularly for statistical analysis.
Big Data Technologies like Spark and Hadoop become important when working with massive datasets that don't fit on a single machine.
Cloud Platforms (AWS, Azure, GCP) are increasingly essential for deploying models and working with large-scale data.
MLOps Tools like Docker, Kubernetes, and MLflow help manage the model lifecycle and deployment.
Statistics and Mathematics at an advanced level – linear algebra, calculus, probability, optimization – form the theoretical foundation.
-
Python: Primary language, extensive library ecosystem
-
SQL: Complex queries, data extraction
-
R: Statistical analysis, academic research
-
Big Data: Spark, Hadoop for massive datasets
-
Cloud: AWS, Azure, GCP for deployment and scale
-
MLOps: Docker, Kubernetes, MLflow for lifecycle management
-
Advanced math: Linear algebra, calculus, optimization
2.4 Typical Data Scientist Job Titles
The data science field includes various specializations and seniority levels.
Data Scientist is the core title, encompassing the full range of responsibilities described above.
Machine Learning Engineer focuses specifically on building and deploying ML systems, often with stronger engineering skills.
ML Ops Engineer specializes in the infrastructure and processes for deploying and maintaining models in production.
Research Scientist works on advancing the field, often in academic or industrial research settings, publishing papers and developing new algorithms.
Applied Scientist applies existing research to solve practical business problems, bridging the gap between research and engineering.
AI Specialist focuses on artificial intelligence applications, including natural language processing, computer vision, and generative AI.
-
Data Scientist: Full range of responsibilities
-
Machine Learning Engineer: Build and deploy ML systems
-
ML Ops Engineer: Infrastructure for model deployment
-
Research Scientist: Advance the field, publish research
-
Applied Scientist: Apply research to business problems
-
AI Specialist: NLP, computer vision, generative AI
Section 3: Head-to-Head Comparison
3.1 Scope and Focus Comparison
| Aspect | Data Analytics | Data Science |
|---|---|---|
| Primary Focus | Analyze historical data for insights | Predict future outcomes, build intelligent systems |
| Time Horizon | Past and present | Future |
| Questions Answered | What happened? Why? | What will happen? What should we do? |
| Output | Reports, dashboards, visualizations | Models, algorithms, prediction systems |
| Complexity | Moderate | High |
| Business Impact | Inform decisions | Automate decisions, create intelligent products |
Data analytics is about understanding what has already happened and why. It provides the insights that inform business decisions. Data science goes further, building systems that can predict future outcomes and even make decisions automatically.
-
Analytics: Descriptive and diagnostic – understanding the past
-
Science: Predictive and prescriptive – shaping the future
-
Different purposes: Informing vs automating decisions
-
Complementary roles: Both valuable, different applications
-
Analytics foundation: Often needed before science can be applied
3.2 Skills Required Comparison
| Skill Area | Data Analytics | Data Science |
|---|---|---|
| SQL | Advanced proficiency | Advanced proficiency |
| Python/R | Intermediate (Pandas, visualization) | Advanced (ML libraries, deep learning) |
| Statistics | Intermediate (descriptive, hypothesis testing) | Advanced (inferential, probability, distributions) |
| Machine Learning | Basic understanding | Advanced (algorithms, tuning, evaluation) |
| Mathematics | Basic algebra | Linear algebra, calculus, optimization |
| Big Data | Rarely needed | Often required |
| Cloud | Occasionally needed | Often required |
| MLOps | Not required | Important for deployment |
Data analysts need strong SQL and Excel skills, intermediate Python, and solid statistical understanding. Data scientists need all of that plus advanced mathematics, machine learning expertise, and often big data and cloud skills.
-
Analyst skills: SQL, Excel, visualization, intermediate stats
-
Scientist skills: All analyst skills plus advanced math, ML, big data
-
Depth difference: Scientists need deeper technical knowledge
-
Breadth difference: Scientists need wider toolset
-
Learning curve: Science requires significantly more study
3.3 Education and Background Comparison
| Aspect | Data Analytics | Data Science |
|---|---|---|
| Common Degrees | B.Com, BBA, B.Sc, BCA, MBA | B.Tech, M.Tech, M.Sc (Stats/Math), PhD |
| Prior Experience | Business, finance, marketing | Engineering, research, software development |
| Training Path | 3-6 months intensive course | 6-12 months intensive + self-study |
| Certifications | Google DA, Microsoft DA | AWS/Azure ML, TensorFlow, Deep Learning |
Data analysts often come from business or commerce backgrounds, adding technical skills through focused training. Data scientists more commonly have engineering, math, or statistics backgrounds, often with advanced degrees.
-
Analyst backgrounds: Commerce, business, arts + technical training
-
Scientist backgrounds: Engineering, math, stats, often advanced degrees
-
Training duration: Analysts faster to train, scientists need deeper study
-
Career switchers: Analytics more accessible for non-technical backgrounds
-
Entry barrier: Analytics lower, science higher
3.4 Salary Comparison
| Experience | Data Analytics (India) | Data Science (India) |
|---|---|---|
| Fresher (0-1 years) | ₹3-6 LPA | ₹5-8 LPA |
| Early Career (1-3 years) | ₹5-9 LPA | ₹8-14 LPA |
| Mid-Career (4-6 years) | ₹8-14 LPA | ₹14-22 LPA |
| Senior (7-10 years) | ₹12-20 LPA | ₹22-35 LPA |
| Lead/Manager (10+ years) | ₹18-30 LPA | ₹30-50 LPA+ |
Data scientists typically command higher salaries due to the advanced skills required and the greater business impact of their work. However, data analytics roles are more numerous and accessible, especially for entry-level candidates.
-
Scientist premium: 30-50% higher salaries at all levels
-
Entry barrier: Analytics easier to enter, science requires deeper skills
-
Career ceiling: Both have high ceilings, science potentially higher
-
ROI consideration: Analytics faster to learn, science higher earning potential
-
Job availability: More analytics roles, especially at entry-level
3.5 Day-to-Day Work Comparison
| Aspect | Data Analytics | Data Science |
|---|---|---|
| Typical Tasks | Querying data, building reports, meeting stakeholders | Feature engineering, model training, debugging algorithms |
| Collaboration | Regular interaction with business teams | Often more independent, collaboration with engineers |
| Tools Used | SQL, Excel, Power BI, Tableau | Python, Jupyter, TensorFlow, cloud platforms |
| Problem Type | Well-defined business questions | Open-ended, exploratory problems |
| Success Metrics | Dashboard adoption, stakeholder satisfaction | Model accuracy, business impact, innovation |
Data analysts spend more time interacting with business stakeholders and creating reports and dashboards. Data scientists spend more time coding, building models, and working on complex technical problems.
-
Analyst work: Business-facing, reporting, dashboards, meetings
-
Scientist work: Technical, modeling, algorithm development, coding
-
Collaboration patterns: Analysts with business, scientists with engineers
-
Problem nature: Analyst problems defined, scientist problems exploratory
-
Work environment: Analysts more structured, scientists more research-oriented


Comments
No comments yet. Be the first to comment.
Leave a Comment